Resource
| Id | Histone_ChIP-seq/ENCSR125IJY |
|---|---|
| Type | position_score |
| Version | 0 |
| Summary | Histone_ChIP-seq ENCSR125IJY [biosample_summary="Homo sapiens SK-N-SH" and target="H3F3A"] |
| Description |
status: released biological_replicates: Rep 1, Rep 2 summary: output_type: replicated peaks audit_internal_action: Archived analysis {ENCAN291VUG|/analyses/ENCAN291VUG/} has in progress subobject quality standard {encode3-histone-chip|/quality-standards/encode3-histone-chip/} audit_not_compliant: Processed alignments file {ENCFF754AJD|/files/ENCFF754AJD/} processed by ChIP-seq ENCODE3 hg19 pipeline has 22897336 usable fragments. The minimum ENCODE standard for each replicate in a ChIP-seq experiment targeting H3F3A-human and investigated as a broad histone mark is 20 million usable fragments. The recommended value is > 45 million, but > 35 million is acceptable. (See {ENCODE ChIP-seq data standards|/data-standards/chip-seq/}) audit_not_compliant: Processed alignments file {ENCFF671ZSB|/files/ENCFF671ZSB/} processed by ChIP-seq ENCODE3 hg19 pipeline has 22504933 usable fragments. The minimum ENCODE standard for each replicate in a ChIP-seq experiment targeting H3F3A-human and investigated as a broad histone mark is 20 million usable fragments. The recommended value is > 45 million, but > 35 million is acceptable. (See {ENCODE ChIP-seq data standards|/data-standards/chip-seq/}) audit_warning: PBC2 (PCR Bottlenecking Coefficient 2, M1/M2) is the ratio of the number of genomic locations where exactly one read maps uniquely (M1) to the number of genomic locations where two reads map uniquely (M2). A PBC2 value in the range 0 - 1 is severe bottlenecking, 1 - 3 is moderate bottlenecking, 3 - 10 is mild bottlenecking, > 10 is no bottlenecking. PBC2 value > 10 is recommended, but > 3 is acceptable. ENCODE processed alignments file {ENCFF671ZSB|/files/ENCFF671ZSB/} processed by ChIP-seq ENCODE3 hg19 pipeline was generated from a library with PBC2 value of 9.93. |
| Labels |
|
Scores (1)
| ID | Type | Default annotation | Description | Histogram | Range | Summary |
|---|---|---|---|---|---|---|
| Histone_ChIP-seq_ENCSR125IJY | float |
Histone_ChIP-seq_ENCSR125IJY |
Histone_ChIP-seq ENCSR125IJY [biosample_summary="Homo sapiens SK-N-SH" and target="H3F3A"]
|
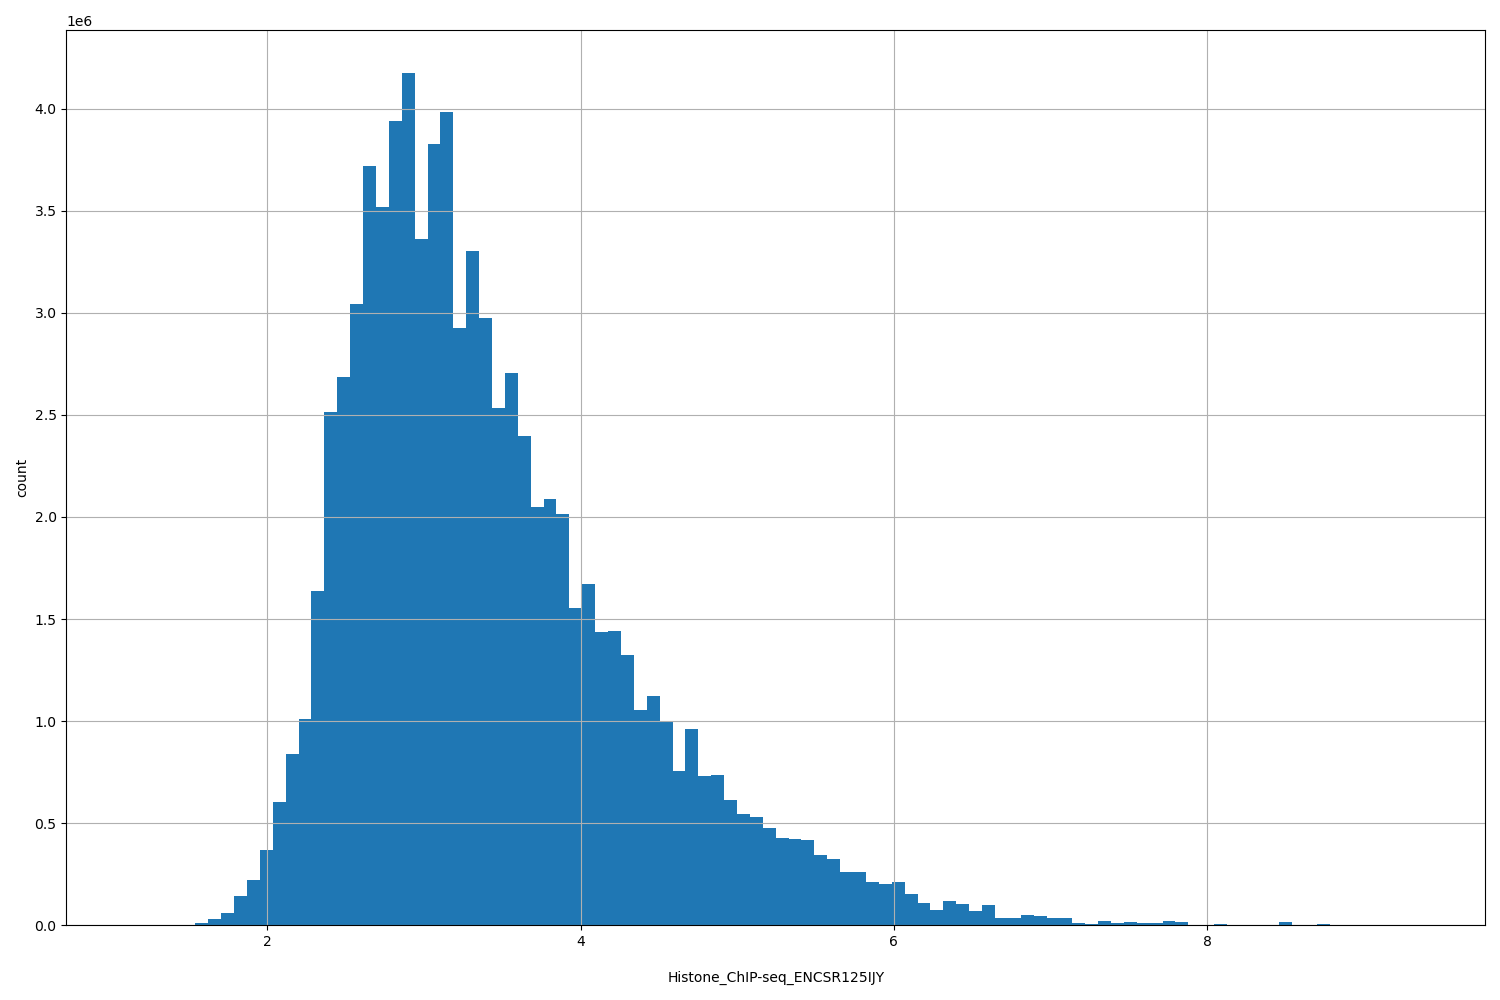 |
[1.13, 9.36] |
|
n counts base pairs; sd is the population standard deviation.
Coverage
| Chromosome | Covered positions | Covered % | Segments |
|---|---|---|---|
| all chromosomes | 82912397 | 2.58% | 109272 |
| chr1 | 8184737 | 3.29% | 10753 |
| chr2 | 6858233 | 2.83% | 8918 |
| chr3 | 5687664 | 2.87% | 7460 |
| chr4 | 4283558 | 2.25% | 5732 |
| chr5 | 5199954 | 2.86% | 6865 |
| chr6 | 4695356 | 2.75% | 6258 |
| chr7 | 5199406 | 3.26% | 6337 |
| chr8 | 3343141 | 2.30% | 4569 |
| chr9 | 3381262 | 2.44% | 4586 |
| chr10 | 3893280 | 2.91% | 5133 |
| chr11 | 4407320 | 3.26% | 5501 |
| chr12 | 4726055 | 3.55% | 6096 |
| chr13 | 2182455 | 1.91% | 2971 |
| chr14 | 2463399 | 2.30% | 3299 |
| chr15 | 3127238 | 3.07% | 4039 |
| chr16 | 2249682 | 2.49% | 3157 |
| chr17 | 4471846 | 5.37% | 5582 |
| chr18 | 1529032 | 1.90% | 2114 |
| chr19 | 2287485 | 3.90% | 3311 |
| chr20 | 1704704 | 2.65% | 2330 |
| chr21 | 801223 | 1.72% | 1075 |
| chr22 | 994546 | 1.96% | 1328 |
| chrX | 1240821 | 0.80% | 1858 |
| 3343 contigs with no values (186304500 bp) | 0 | 0.00% | 0 |
Segment lengths
| segments | min | max | mean | median | |
|---|---|---|---|---|---|
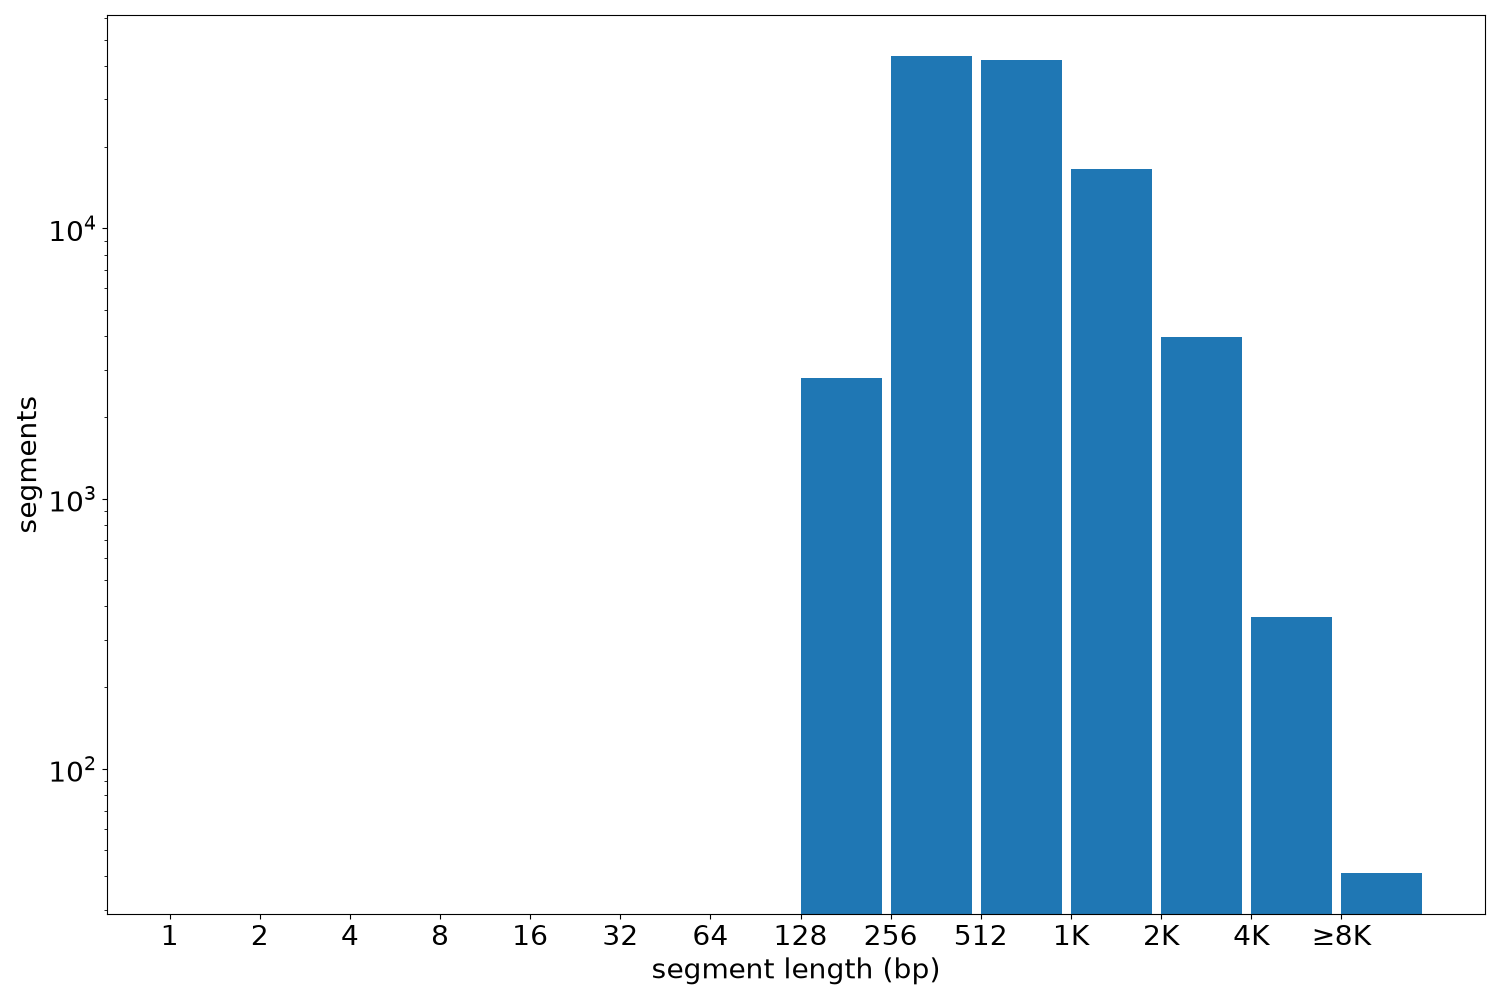
| segments | 109272 | 205 | 19546 | 758.77 | 572 |
Files
| Filename | Size | md5 |
|---|---|---|
| ENCFF202WFY.bed.gz | 2.55 MB | a79237e07bfe6eea7b0f0d9c2d0dc9b8 |
| ENCFF202WFY.tabix.bed.gz | 1.14 MB | c6e776f1eaac6d39b2c1b0f81884ef0f |
| ENCFF202WFY.tabix.bed.gz.tbi | 312.58 KB | 17a24eb61ebaf973a10e4df47c8337c7 |
| genomic_resource.yaml | 3.0 KB | 410cb7e4cf25d00ca612e2f752e024dc |
| statistics/ |