Resource
| Id | Histone_ChIP-seq/ENCSR077FZT |
|---|---|
| Type | position_score |
| Version | 0 |
| Summary | Histone_ChIP-seq ENCSR077FZT [biosample_summary="Homo sapiens CD4-positive, alpha-beta memory T cell" and target="H3K4me3"] |
| Description |
status: released biological_replicates: Rep 1 summary: output_type: pseudoreplicated peaks audit_internal_action: Archived analysis {ENCAN576JOG|/analyses/ENCAN576JOG/} has in progress subobject quality standard {encode3-histone-chip|/quality-standards/encode3-histone-chip/} audit_warning: PBC1 (PCR Bottlenecking Coefficient 1, M1/M_distinct) is the ratio of the number of genomic locations where exactly one read maps uniquely (M1) to the number of genomic locations where some reads map (M_distinct). A PBC1 value in the range 0 - 0.5 is severe bottlenecking, 0.5 - 0.8 is moderate bottlenecking, 0.8 - 0.9 is mild bottlenecking, and > 0.9 is no bottlenecking. PBC1 value > 0.9 is recommended, but > 0.8 is acceptable. ENCODE processed redacted alignments file {ENCFF466SWT|/files/ENCFF466SWT/} processed by ChIP-seq ENCODE3 hg19 pipeline was generated from a library with PBC1 value of 0.85. audit_warning: PBC2 (PCR Bottlenecking Coefficient 2, M1/M2) is the ratio of the number of genomic locations where exactly one read maps uniquely (M1) to the number of genomic locations where two reads map uniquely (M2). A PBC2 value in the range 0 - 1 is severe bottlenecking, 1 - 3 is moderate bottlenecking, 3 - 10 is mild bottlenecking, > 10 is no bottlenecking. PBC2 value > 10 is recommended, but > 3 is acceptable. ENCODE processed redacted alignments file {ENCFF466SWT|/files/ENCFF466SWT/} processed by ChIP-seq ENCODE3 hg19 pipeline was generated from a library with PBC2 value of 6.61. |
| Labels |
|
Scores (1)
| ID | Type | Default annotation | Description | Histogram | Range | Summary |
|---|---|---|---|---|---|---|
| Histone_ChIP-seq_ENCSR077FZT | float |
Histone_ChIP-seq_ENCSR077FZT |
Histone_ChIP-seq ENCSR077FZT [biosample_summary="Homo sapiens CD4-positive, alpha-beta memory T cell" and target="H3K4me3"]
|
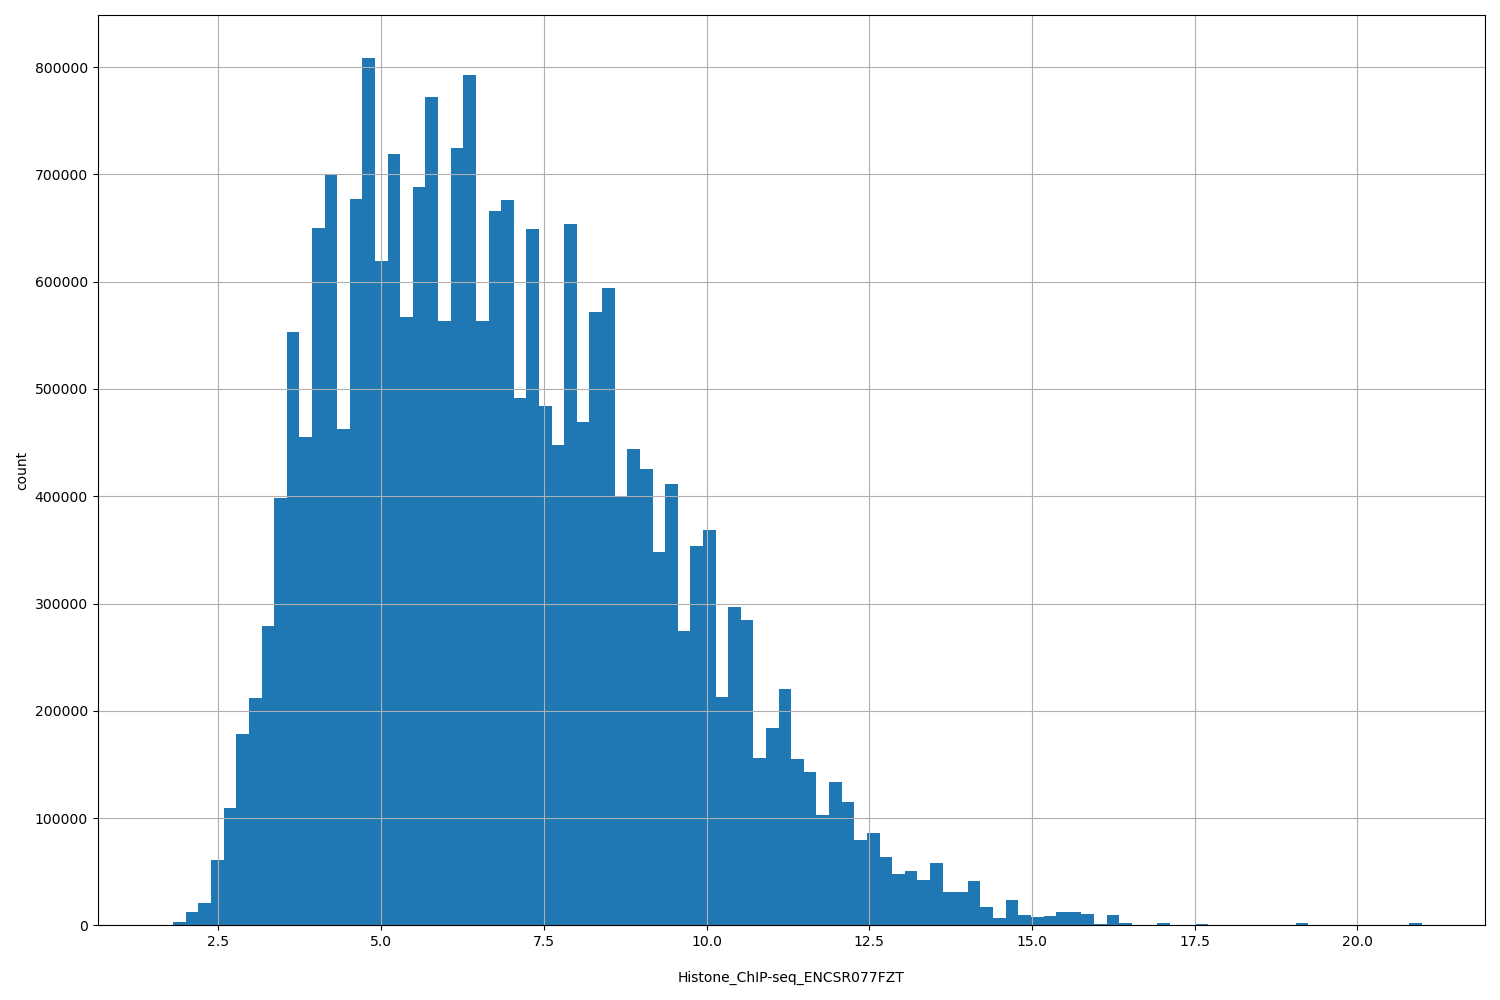 |
[1.61, 21] |
|
n counts base pairs; sd is the population standard deviation.
Coverage
| Chromosome | Covered positions | Covered % | Segments |
|---|---|---|---|
| all chromosomes | 22986052 | 0.71% | 23162 |
| chr1 | 2413515 | 0.97% | 2341 |
| chr2 | 1616744 | 0.67% | 1627 |
| chr3 | 1294841 | 0.65% | 1292 |
| chr4 | 810817 | 0.43% | 816 |
| chr5 | 1102988 | 0.61% | 1046 |
| chr6 | 1460585 | 0.86% | 1419 |
| chr7 | 983032 | 0.62% | 1018 |
| chr8 | 770760 | 0.53% | 803 |
| chr9 | 864800 | 0.62% | 875 |
| chr10 | 947553 | 0.71% | 964 |
| chr11 | 1287472 | 0.95% | 1250 |
| chr12 | 1279648 | 0.96% | 1217 |
| chr13 | 505384 | 0.44% | 529 |
| chr14 | 880698 | 0.82% | 888 |
| chr15 | 718133 | 0.70% | 736 |
| chr16 | 879404 | 0.97% | 950 |
| chr17 | 1349867 | 1.62% | 1356 |
| chr18 | 341674 | 0.43% | 348 |
| chr19 | 1523566 | 2.60% | 1597 |
| chr20 | 576956 | 0.90% | 591 |
| chr21 | 254941 | 0.55% | 287 |
| chr22 | 521609 | 1.03% | 544 |
| chrX | 576707 | 0.37% | 642 |
| chrY | 24358 | 0.04% | 26 |
| 3342 contigs with no values (129077085 bp) | 0 | 0.00% | 0 |
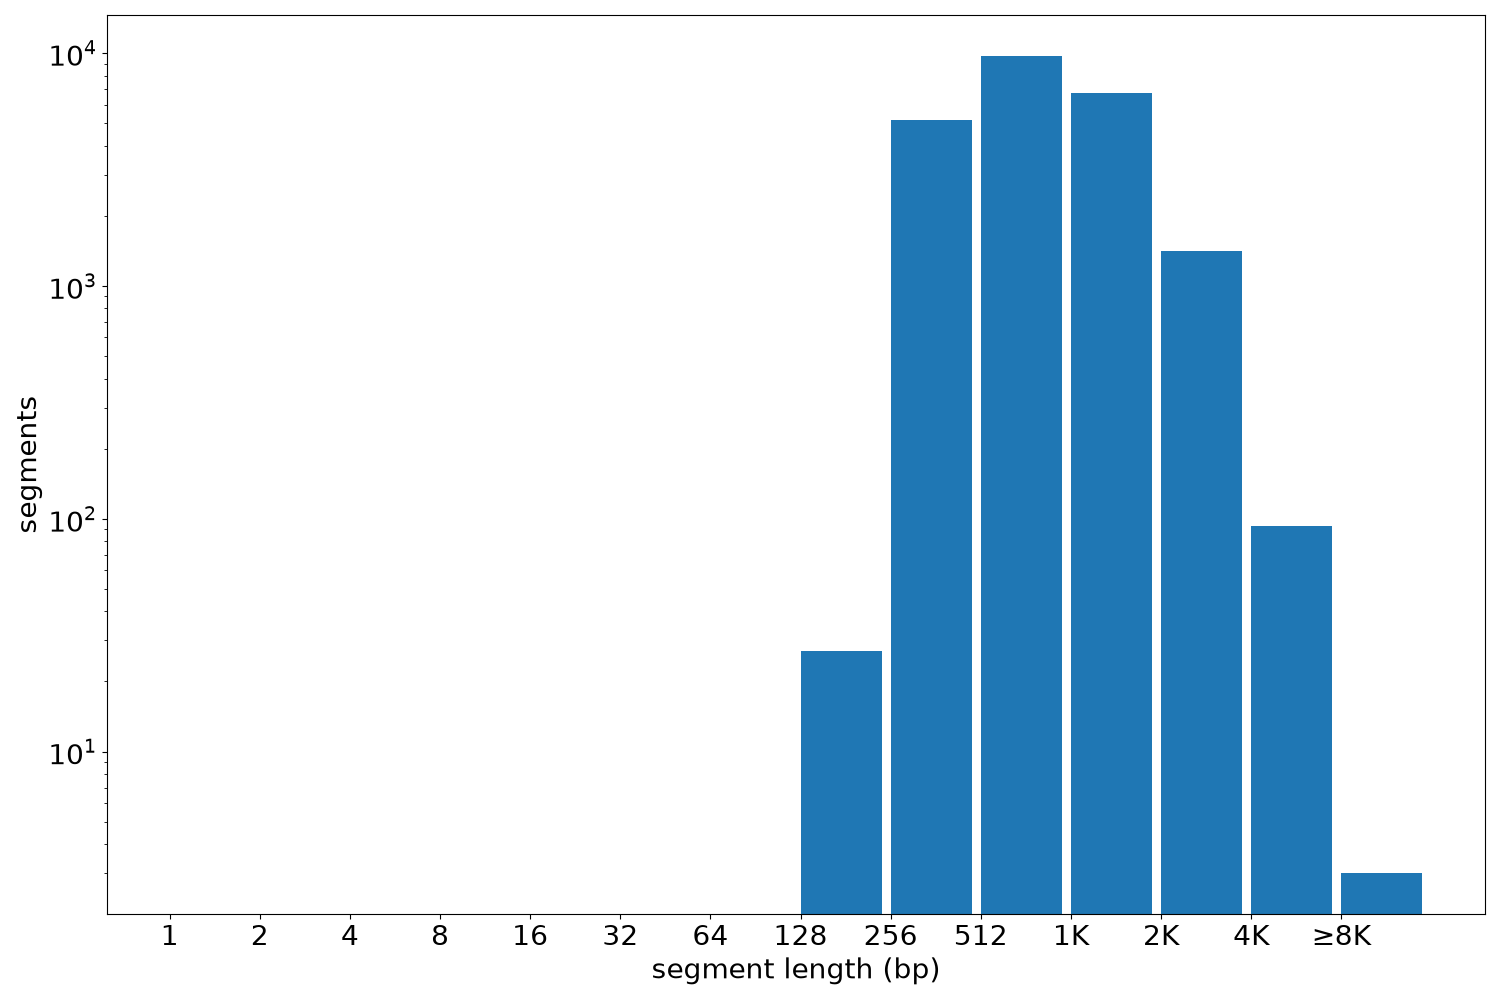
Segment lengths
| segments | min | max | mean | median | |
|---|---|---|---|---|---|
| segments | 23162 | 240 | 9468 | 992.4 | 810 |
Files
| Filename | Size | md5 |
|---|---|---|
| ENCFF925RBM.bed.gz | 532.02 KB | 08aade3ffca60020739e48f7bdbd1c7b |
| ENCFF925RBM.tabix.bed.gz | 248.45 KB | 2616705ed9baa49638e53cc4a59b43cb |
| ENCFF925RBM.tabix.bed.gz.tbi | 122.91 KB | 1a685b15275716efc07a3b97e72836fe |
| genomic_resource.yaml | 2.78 KB | a3a01bd894119d14db0ef6b00460fd8a |
| statistics/ |