Resource
| Id | Histone_ChIP-seq/ENCSR065ZNA |
|---|---|
| Type | position_score |
| Version | 0 |
| Summary | Histone_ChIP-seq ENCSR065ZNA [biosample_summary="Homo sapiens aorta tissue male adult (34 years)" and target="H3K9me3"] |
| Description |
status: released biological_replicates: Rep 1 summary: male adult (34 years) output_type: pseudoreplicated peaks audit_internal_action: Released analysis {ENCAN492THE|/analyses/ENCAN492THE/} has in progress subobject quality standard {encode4-histone-chip|/quality-standards/encode4-histone-chip/} audit_internal_action: Released analysis {ENCAN492THE|/analyses/ENCAN492THE/} has in progress subobject document {0fa5fb9c-7574-4cd6-bbda-bcb2f84810f4|/documents/0fa5fb9c-7574-4cd6-bbda-bcb2f84810f4/} audit_warning: PBC1 (PCR Bottlenecking Coefficient 1, M1/M_distinct) is the ratio of the number of genomic locations where exactly one read maps uniquely (M1) to the number of genomic locations where some reads map (M_distinct). A PBC1 value in the range 0 - 0.5 is severe bottlenecking, 0.5 - 0.8 is moderate bottlenecking, 0.8 - 0.9 is mild bottlenecking, and > 0.9 is no bottlenecking. PBC1 value > 0.9 is recommended, but > 0.8 is acceptable. ENCODE processed alignments file {ENCFF171VPV|/files/ENCFF171VPV/} processed by ChIP-seq ENCODE4 v1.6.1 GRCh38 pipeline was generated from a library with PBC1 value of 0.83. audit_warning: PBC2 (PCR Bottlenecking Coefficient 2, M1/M2) is the ratio of the number of genomic locations where exactly one read maps uniquely (M1) to the number of genomic locations where two reads map uniquely (M2). A PBC2 value in the range 0 - 1 is severe bottlenecking, 1 - 3 is moderate bottlenecking, 3 - 10 is mild bottlenecking, > 10 is no bottlenecking. PBC2 value > 10 is recommended, but > 3 is acceptable. ENCODE processed alignments file {ENCFF171VPV|/files/ENCFF171VPV/} processed by ChIP-seq ENCODE4 v1.6.1 GRCh38 pipeline was generated from a library with PBC2 value of 6.21. |
| Labels |
|
Scores (1)
| ID | Type | Default annotation | Description | Histogram | Range | Summary |
|---|---|---|---|---|---|---|
| Histone_ChIP-seq_ENCSR065ZNA | float |
Histone_ChIP-seq_ENCSR065ZNA |
Histone_ChIP-seq ENCSR065ZNA [biosample_summary="Homo sapiens aorta tissue male adult (34 years)" and target="H3K9me3"]
|
 |
[1.87, 16.9] |
|
n counts base pairs; sd is the population standard deviation.
Coverage
| Chromosome | Covered positions | Covered % | Segments |
|---|---|---|---|
| all chromosomes | 14160225 | 0.44% | 65997 |
| chr1 | 1019790 | 0.41% | 4884 |
| chr2 | 1024344 | 0.42% | 4990 |
| chr3 | 843437 | 0.43% | 4065 |
| chr4 | 840913 | 0.44% | 4052 |
| chr5 | 955096 | 0.53% | 4343 |
| chr6 | 734352 | 0.43% | 3602 |
| chr7 | 830428 | 0.52% | 3939 |
| chr8 | 703808 | 0.48% | 3441 |
| chr9 | 515565 | 0.37% | 2453 |
| chr10 | 661051 | 0.49% | 3147 |
| chr11 | 557161 | 0.41% | 2704 |
| chr12 | 700205 | 0.53% | 3247 |
| chr13 | 406596 | 0.36% | 2026 |
| chr14 | 432080 | 0.40% | 2100 |
| chr15 | 379465 | 0.37% | 1729 |
| chr16 | 464963 | 0.51% | 2134 |
| chr17 | 285578 | 0.34% | 1360 |
| chr18 | 350027 | 0.44% | 1750 |
| chr19 | 1465715 | 2.50% | 5340 |
| chr20 | 361929 | 0.56% | 1734 |
| chr21 | 192481 | 0.41% | 924 |
| chr22 | 172995 | 0.34% | 793 |
| chrX | 229476 | 0.15% | 1079 |
| chrY | 32770 | 0.06% | 161 |
| 3342 contigs with no values (129077085 bp) | 0 | 0.00% | 0 |
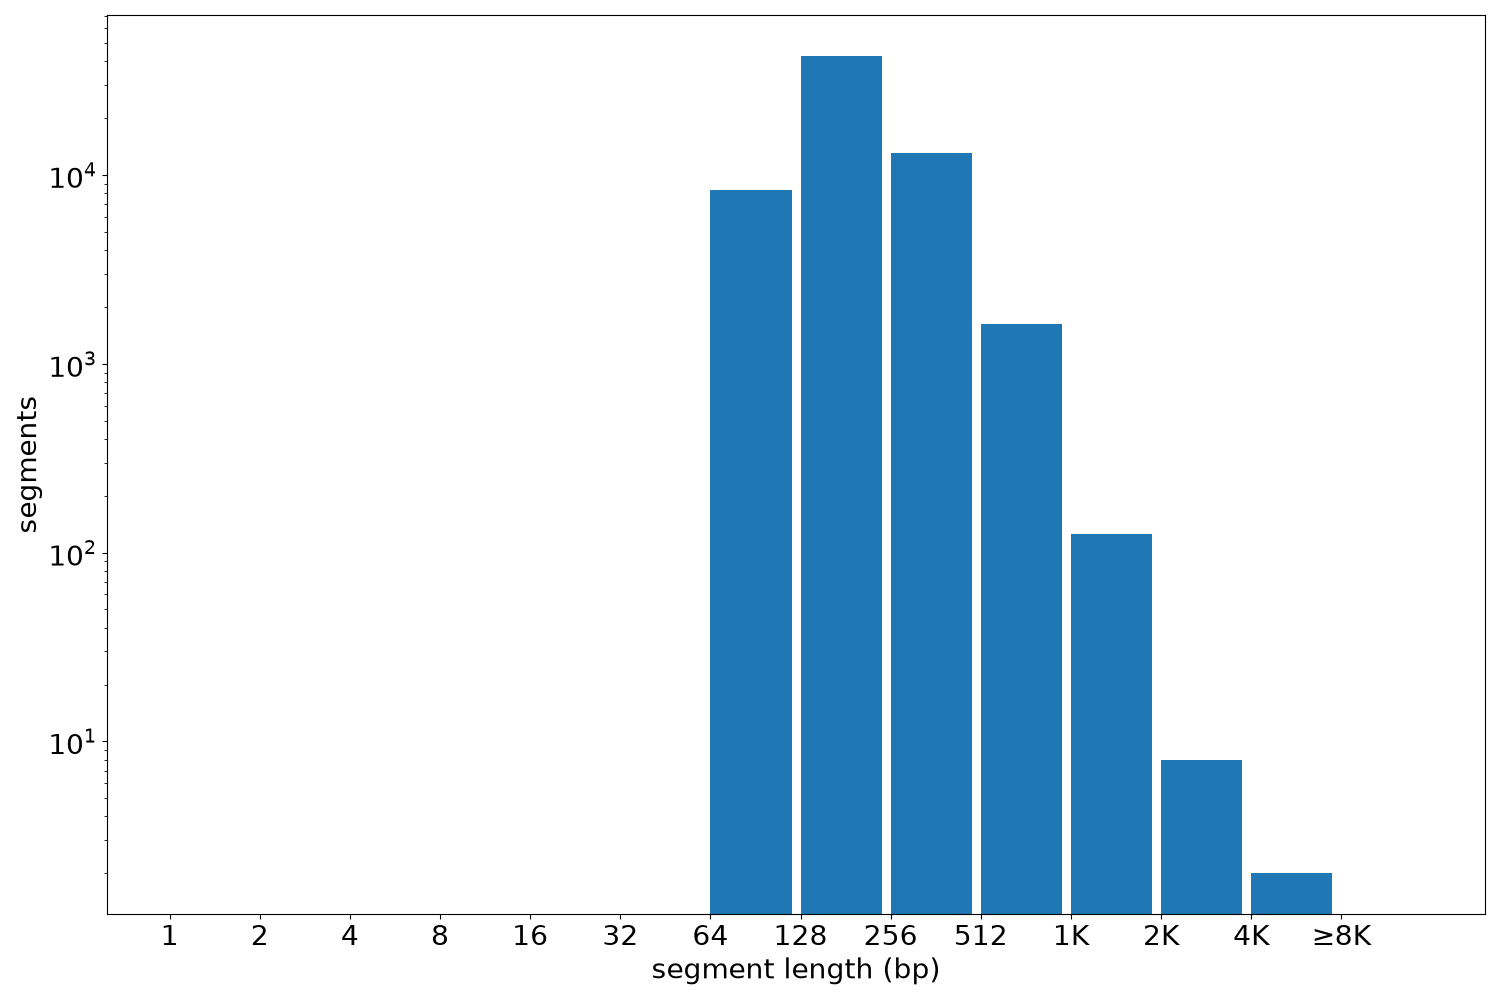
Segment lengths
| segments | min | max | mean | median | |
|---|---|---|---|---|---|
| segments | 65997 | 120 | 5279 | 214.56 | 180 |
Files
| Filename | Size | md5 |
|---|---|---|
| ENCFF357HJQ.bed.gz | 1.14 MB | e9672a05ddd638a86be9d80166eae86b |
| ENCFF357HJQ.tabix.bed.gz | 613.04 KB | 9568b131ec2fd7bc57cfdbd88abcd944 |
| ENCFF357HJQ.tabix.bed.gz.tbi | 311.45 KB | 18fe749a95083ded53eaab5c053de97a |
| genomic_resource.yaml | 2.96 KB | eaa32db567e19dc72f05d0d74b6ac91a |
| statistics/ |