Resource
| Id | Histone_ChIP-seq/ENCSR061UOM |
|---|---|
| Type | position_score |
| Version | 0 |
| Summary | Histone_ChIP-seq ENCSR061UOM [biosample_summary="Homo sapiens Caco-2" and target="H3K4me1"] |
| Description |
status: released biological_replicates: Rep 1, Rep 2 summary: output_type: pseudoreplicated peaks audit_internal_action: Released analysis {ENCAN119AFS|/analyses/ENCAN119AFS/} has in progress subobject quality standard {encode4-histone-chip|/quality-standards/encode4-histone-chip/} audit_warning: PBC1 (PCR Bottlenecking Coefficient 1, M1/M_distinct) is the ratio of the number of genomic locations where exactly one read maps uniquely (M1) to the number of genomic locations where some reads map (M_distinct). A PBC1 value in the range 0 - 0.5 is severe bottlenecking, 0.5 - 0.8 is moderate bottlenecking, 0.8 - 0.9 is mild bottlenecking, and > 0.9 is no bottlenecking. PBC1 value > 0.9 is recommended, but > 0.8 is acceptable. ENCODE processed alignments file {ENCFF469FAN|/files/ENCFF469FAN/} processed by ChIP-seq ENCODE4 v1.5.1 GRCh38 pipeline was generated from a library with PBC1 value of 0.86. audit_warning: PBC2 (PCR Bottlenecking Coefficient 2, M1/M2) is the ratio of the number of genomic locations where exactly one read maps uniquely (M1) to the number of genomic locations where two reads map uniquely (M2). A PBC2 value in the range 0 - 1 is severe bottlenecking, 1 - 3 is moderate bottlenecking, 3 - 10 is mild bottlenecking, > 10 is no bottlenecking. PBC2 value > 10 is recommended, but > 3 is acceptable. ENCODE processed alignments file {ENCFF469FAN|/files/ENCFF469FAN/} processed by ChIP-seq ENCODE4 v1.5.1 GRCh38 pipeline was generated from a library with PBC2 value of 6.93. audit_warning: PBC1 (PCR Bottlenecking Coefficient 1, M1/M_distinct) is the ratio of the number of genomic locations where exactly one read maps uniquely (M1) to the number of genomic locations where some reads map (M_distinct). A PBC1 value in the range 0 - 0.5 is severe bottlenecking, 0.5 - 0.8 is moderate bottlenecking, 0.8 - 0.9 is mild bottlenecking, and > 0.9 is no bottlenecking. PBC1 value > 0.9 is recommended, but > 0.8 is acceptable. ENCODE processed alignments file {ENCFF737KSB|/files/ENCFF737KSB/} processed by ChIP-seq ENCODE4 v1.5.1 GRCh38 pipeline was generated from a library with PBC1 value of 0.82. audit_warning: PBC2 (PCR Bottlenecking Coefficient 2, M1/M2) is the ratio of the number of genomic locations where exactly one read maps uniquely (M1) to the number of genomic locations where two reads map uniquely (M2). A PBC2 value in the range 0 - 1 is severe bottlenecking, 1 - 3 is moderate bottlenecking, 3 - 10 is mild bottlenecking, > 10 is no bottlenecking. PBC2 value > 10 is recommended, but > 3 is acceptable. ENCODE processed alignments file {ENCFF737KSB|/files/ENCFF737KSB/} processed by ChIP-seq ENCODE4 v1.5.1 GRCh38 pipeline was generated from a library with PBC2 value of 5.31. |
| Labels |
|
Scores (1)
| ID | Type | Default annotation | Description | Histogram | Range | Summary |
|---|---|---|---|---|---|---|
| Histone_ChIP-seq_ENCSR061UOM | float |
Histone_ChIP-seq_ENCSR061UOM |
Histone_ChIP-seq ENCSR061UOM [biosample_summary="Homo sapiens Caco-2" and target="H3K4me1"]
|
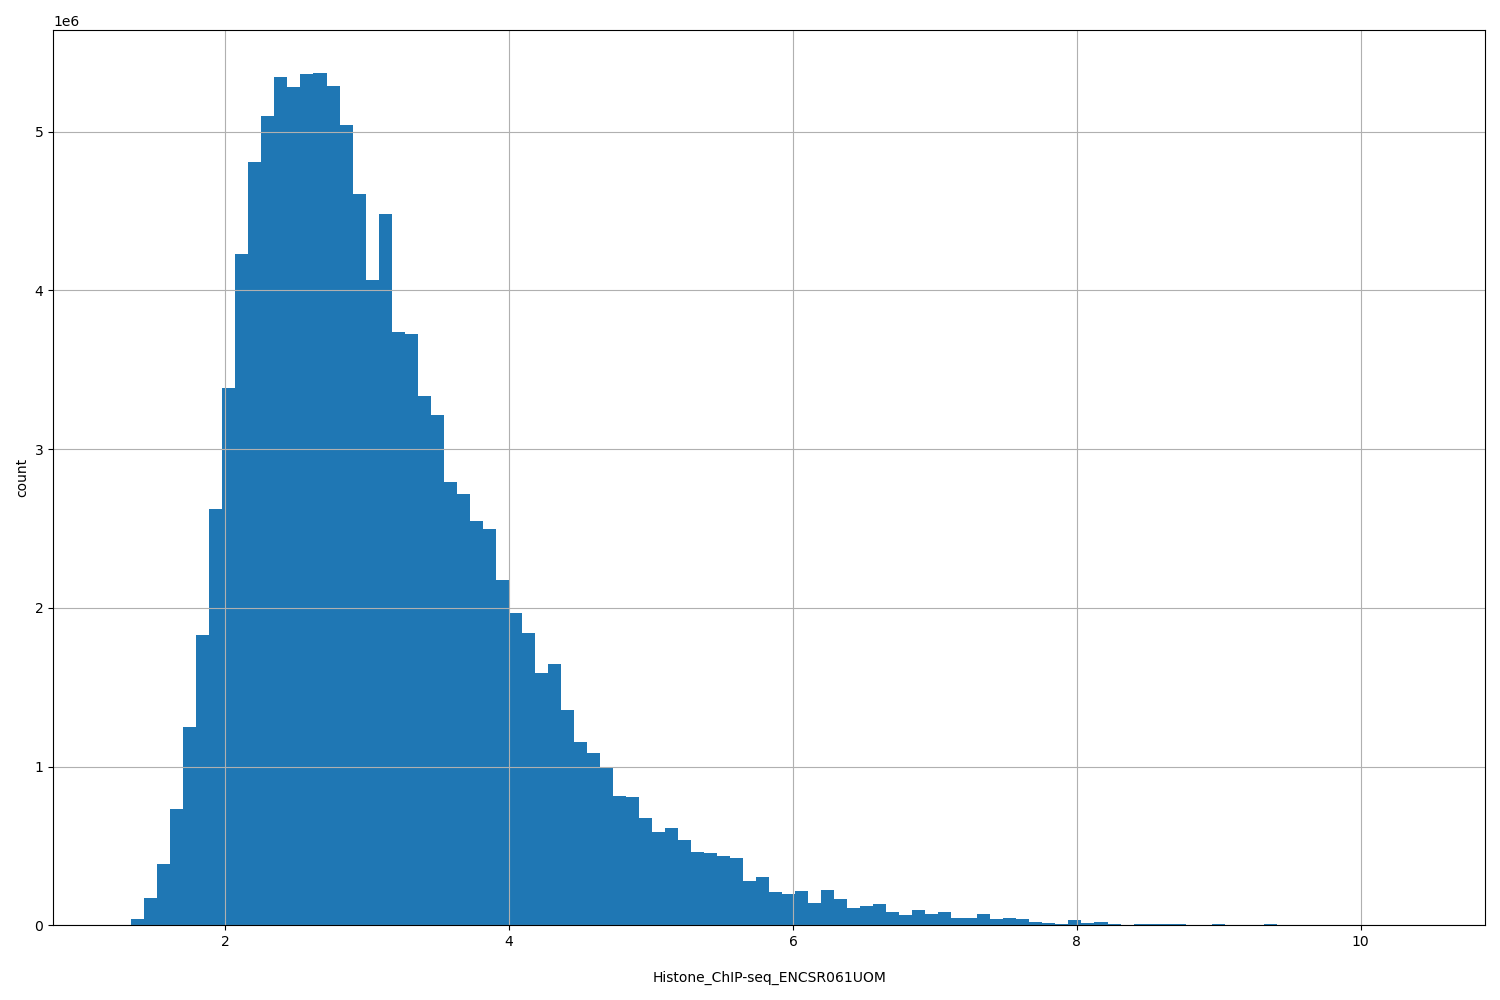 |
[1.24, 10.4] |
|
n counts base pairs; sd is the population standard deviation.
Coverage
| Chromosome | Covered positions | Covered % | Segments |
|---|---|---|---|
| all chromosomes | 116572583 | 3.62% | 106729 |
| chr1 | 9507544 | 3.82% | 8744 |
| chr2 | 9979163 | 4.12% | 8949 |
| chr3 | 8144060 | 4.11% | 7443 |
| chr4 | 5678052 | 2.99% | 5371 |
| chr5 | 6963365 | 3.84% | 6352 |
| chr6 | 7330756 | 4.29% | 6875 |
| chr7 | 5886112 | 3.69% | 5545 |
| chr8 | 5066691 | 3.49% | 4704 |
| chr9 | 3674220 | 2.65% | 3547 |
| chr10 | 7042058 | 5.26% | 6078 |
| chr11 | 7688657 | 5.69% | 6543 |
| chr12 | 6638800 | 4.98% | 5964 |
| chr13 | 3852752 | 3.37% | 3346 |
| chr14 | 3804352 | 3.55% | 3484 |
| chr15 | 3616235 | 3.55% | 3290 |
| chr16 | 3453168 | 3.82% | 3291 |
| chr17 | 4919334 | 5.91% | 4544 |
| chr18 | 1827869 | 2.27% | 1702 |
| chr19 | 2525312 | 4.31% | 2697 |
| chr20 | 3940199 | 6.11% | 3394 |
| chr21 | 1335846 | 2.86% | 1192 |
| chr22 | 2020355 | 3.98% | 1788 |
| chrX | 1676904 | 1.07% | 1885 |
| chrY | 779 | <0.01% | 1 |
| 3342 contigs with no values (129077085 bp) | 0 | 0.00% | 0 |
Segment lengths
| segments | min | max | mean | median | |
|---|---|---|---|---|---|
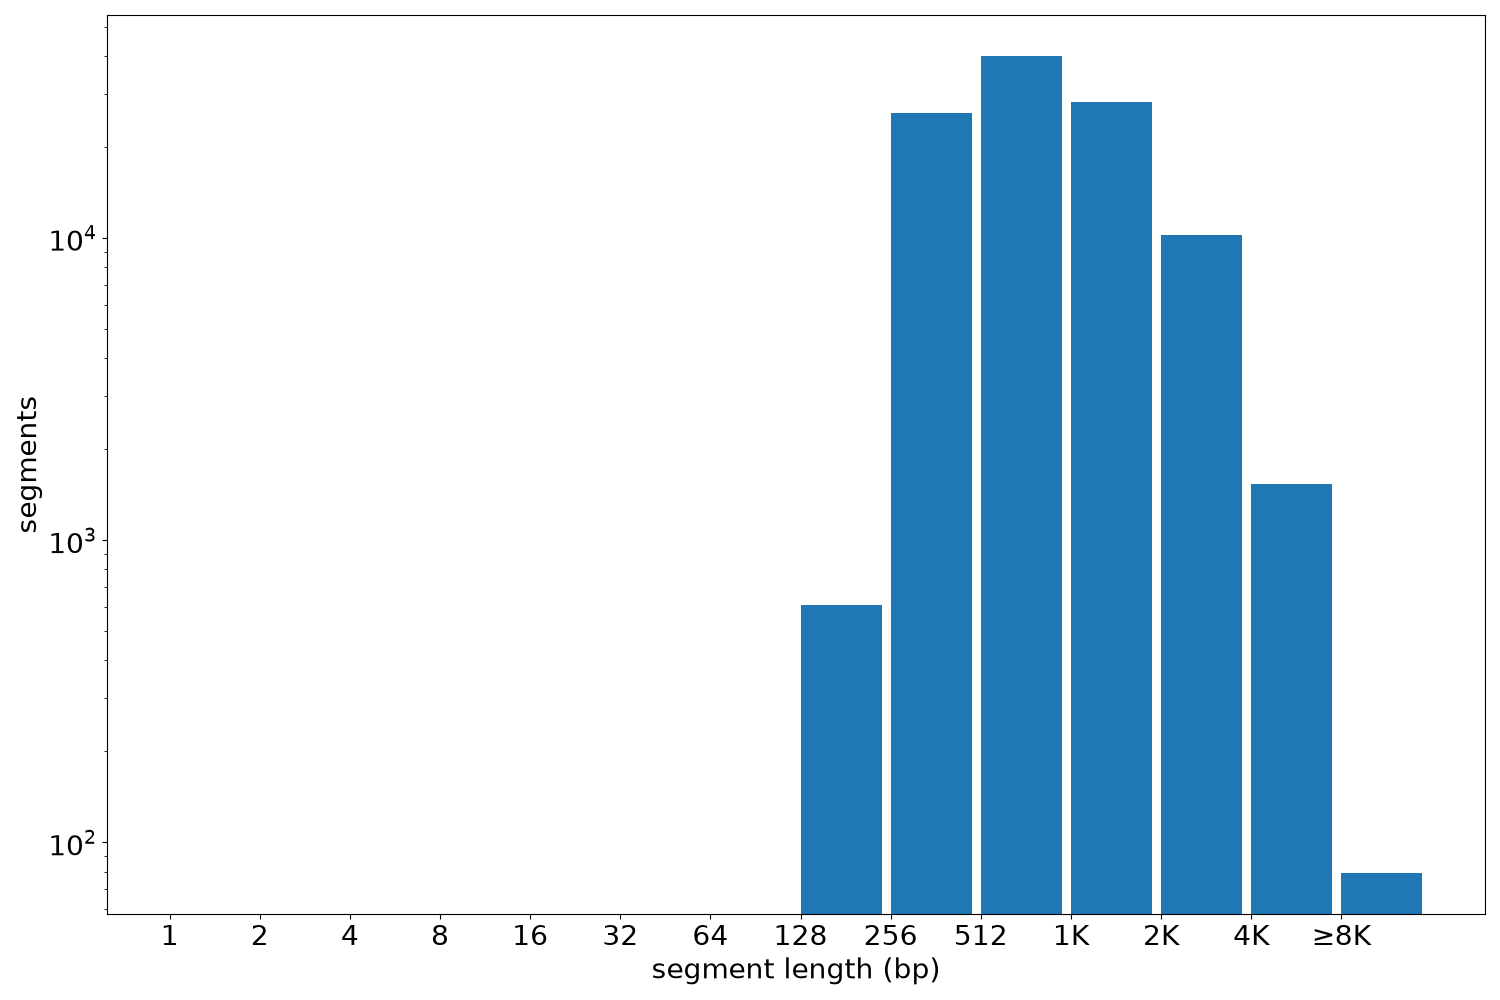
| segments | 106729 | 235 | 22559 | 1092.23 | 807 |
Files
| Filename | Size | md5 |
|---|---|---|
| ENCFF095KMQ.bed.gz | 2.71 MB | 2402738c9e224b9a9907bec502b47a93 |
| ENCFF095KMQ.tabix.bed.gz | 1.14 MB | b4364494fe6638d3091c7042afe0dfa4 |
| ENCFF095KMQ.tabix.bed.gz.tbi | 326.68 KB | bd7b8558afd110753fe989ce0dbf0128 |
| genomic_resource.yaml | 4.0 KB | 45e61362e4a9dc458a9a106fbdf83650 |
| statistics/ |