Resource
| Id | Histone_ChIP-seq/ENCSR000DXU |
|---|---|
| Type | position_score |
| Version | 0 |
| Summary | Histone_ChIP-seq ENCSR000DXU [biosample_summary="Homo sapiens WERI-Rb-1" and target="H3K4me3"] |
| Description |
status: released biological_replicates: Rep 1, Rep 2 summary: output_type: replicated peaks audit_internal_action: Archived analysis {ENCAN010DPE|/analyses/ENCAN010DPE/} has in progress subobject quality standard {encode3-histone-chip|/quality-standards/encode3-histone-chip/} audit_warning: Processed alignments file {ENCFF195NMV|/files/ENCFF195NMV/} processed by ChIP-seq ENCODE3 hg19 pipeline has 14614602 usable fragments. The minimum ENCODE standard for each replicate in a ChIP-seq experiment targeting H3K4me3-human and investigated as a narrow histone mark is 10 million usable fragments. The recommended value is > 20 million, but > 10 million is acceptable. (See {ENCODE ChIP-seq data standards|/data-standards/chip-seq/}) audit_warning: Processed alignments file {ENCFF289SMU|/files/ENCFF289SMU/} processed by ChIP-seq ENCODE3 hg19 pipeline has 14897472 usable fragments. The minimum ENCODE standard for each replicate in a ChIP-seq experiment targeting H3K4me3-human and investigated as a narrow histone mark is 10 million usable fragments. The recommended value is > 20 million, but > 10 million is acceptable. (See {ENCODE ChIP-seq data standards|/data-standards/chip-seq/}) audit_warning: PBC1 (PCR Bottlenecking Coefficient 1, M1/M_distinct) is the ratio of the number of genomic locations where exactly one read maps uniquely (M1) to the number of genomic locations where some reads map (M_distinct). A PBC1 value in the range 0 - 0.5 is severe bottlenecking, 0.5 - 0.8 is moderate bottlenecking, 0.8 - 0.9 is mild bottlenecking, and > 0.9 is no bottlenecking. PBC1 value > 0.9 is recommended, but > 0.8 is acceptable. ENCODE processed alignments file {ENCFF195NMV|/files/ENCFF195NMV/} processed by ChIP-seq ENCODE3 hg19 pipeline was generated from a library with PBC1 value of 0.89. audit_warning: PBC2 (PCR Bottlenecking Coefficient 2, M1/M2) is the ratio of the number of genomic locations where exactly one read maps uniquely (M1) to the number of genomic locations where two reads map uniquely (M2). A PBC2 value in the range 0 - 1 is severe bottlenecking, 1 - 3 is moderate bottlenecking, 3 - 10 is mild bottlenecking, > 10 is no bottlenecking. PBC2 value > 10 is recommended, but > 3 is acceptable. ENCODE processed alignments file {ENCFF195NMV|/files/ENCFF195NMV/} processed by ChIP-seq ENCODE3 hg19 pipeline was generated from a library with PBC2 value of 9.77. audit_warning: PBC1 (PCR Bottlenecking Coefficient 1, M1/M_distinct) is the ratio of the number of genomic locations where exactly one read maps uniquely (M1) to the number of genomic locations where some reads map (M_distinct). A PBC1 value in the range 0 - 0.5 is severe bottlenecking, 0.5 - 0.8 is moderate bottlenecking, 0.8 - 0.9 is mild bottlenecking, and > 0.9 is no bottlenecking. PBC1 value > 0.9 is recommended, but > 0.8 is acceptable. ENCODE processed alignments file {ENCFF289SMU|/files/ENCFF289SMU/} processed by ChIP-seq ENCODE3 hg19 pipeline was generated from a library with PBC1 value of 0.88. audit_warning: PBC2 (PCR Bottlenecking Coefficient 2, M1/M2) is the ratio of the number of genomic locations where exactly one read maps uniquely (M1) to the number of genomic locations where two reads map uniquely (M2). A PBC2 value in the range 0 - 1 is severe bottlenecking, 1 - 3 is moderate bottlenecking, 3 - 10 is mild bottlenecking, > 10 is no bottlenecking. PBC2 value > 10 is recommended, but > 3 is acceptable. ENCODE processed alignments file {ENCFF289SMU|/files/ENCFF289SMU/} processed by ChIP-seq ENCODE3 hg19 pipeline was generated from a library with PBC2 value of 8.88. |
| Labels |
|
Scores (1)
| ID | Type | Default annotation | Description | Histogram | Range | Summary |
|---|---|---|---|---|---|---|
| Histone_ChIP-seq_ENCSR000DXU | float |
Histone_ChIP-seq_ENCSR000DXU |
Histone_ChIP-seq ENCSR000DXU [biosample_summary="Homo sapiens WERI-Rb-1" and target="H3K4me3"]
|
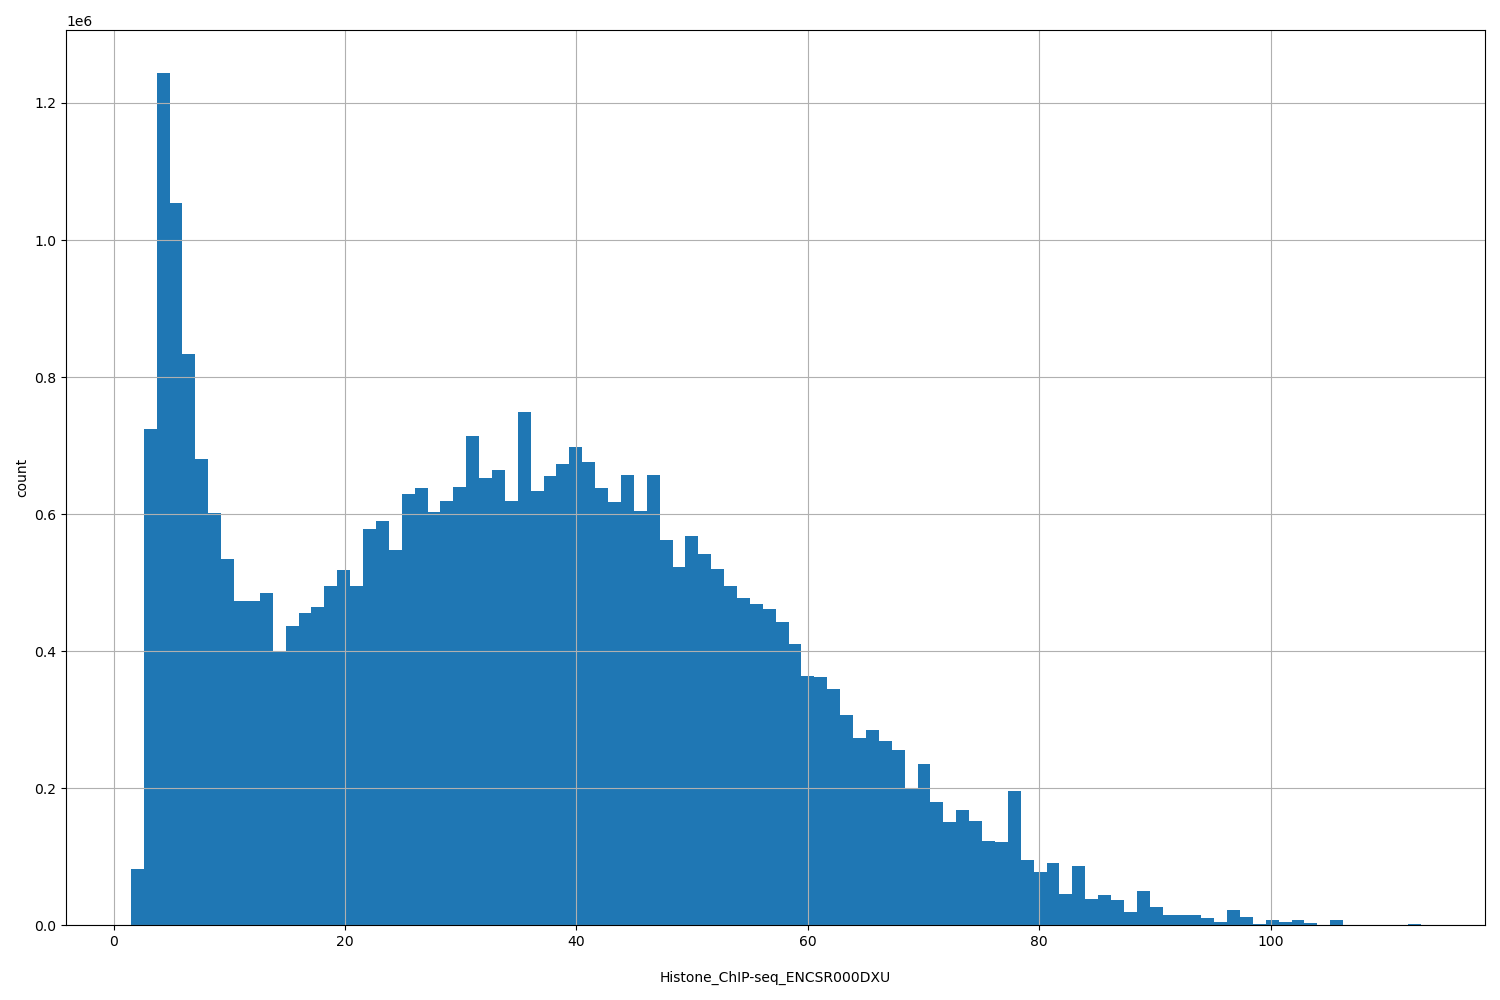 |
[1.49, 113] |
|
n counts base pairs; sd is the population standard deviation.
Coverage
| Chromosome | Covered positions | Covered % | Segments |
|---|---|---|---|
| all chromosomes | 35421084 | 1.10% | 31268 |
| chr1 | 3509928 | 1.41% | 3092 |
| chr2 | 2472947 | 1.02% | 2134 |
| chr3 | 1938853 | 0.98% | 1619 |
| chr4 | 1493558 | 0.79% | 1207 |
| chr5 | 1679436 | 0.93% | 1413 |
| chr6 | 2054773 | 1.20% | 1678 |
| chr7 | 1692473 | 1.06% | 1599 |
| chr8 | 1389781 | 0.96% | 1195 |
| chr9 | 1534907 | 1.11% | 1412 |
| chr10 | 1453971 | 1.09% | 1320 |
| chr11 | 1830170 | 1.35% | 1628 |
| chr12 | 1874362 | 1.41% | 1587 |
| chr13 | 772471 | 0.68% | 664 |
| chr14 | 1174711 | 1.10% | 997 |
| chr15 | 1205673 | 1.18% | 1075 |
| chr16 | 1371714 | 1.52% | 1318 |
| chr17 | 2096262 | 2.52% | 1845 |
| chr18 | 676941 | 0.84% | 617 |
| chr19 | 2199613 | 3.75% | 1995 |
| chr20 | 908401 | 1.41% | 880 |
| chr21 | 367381 | 0.79% | 353 |
| chr22 | 729618 | 1.44% | 738 |
| chrX | 992424 | 0.64% | 901 |
| chrY | 716 | <0.01% | 1 |
| 3342 contigs with no values (129077085 bp) | 0 | 0.00% | 0 |
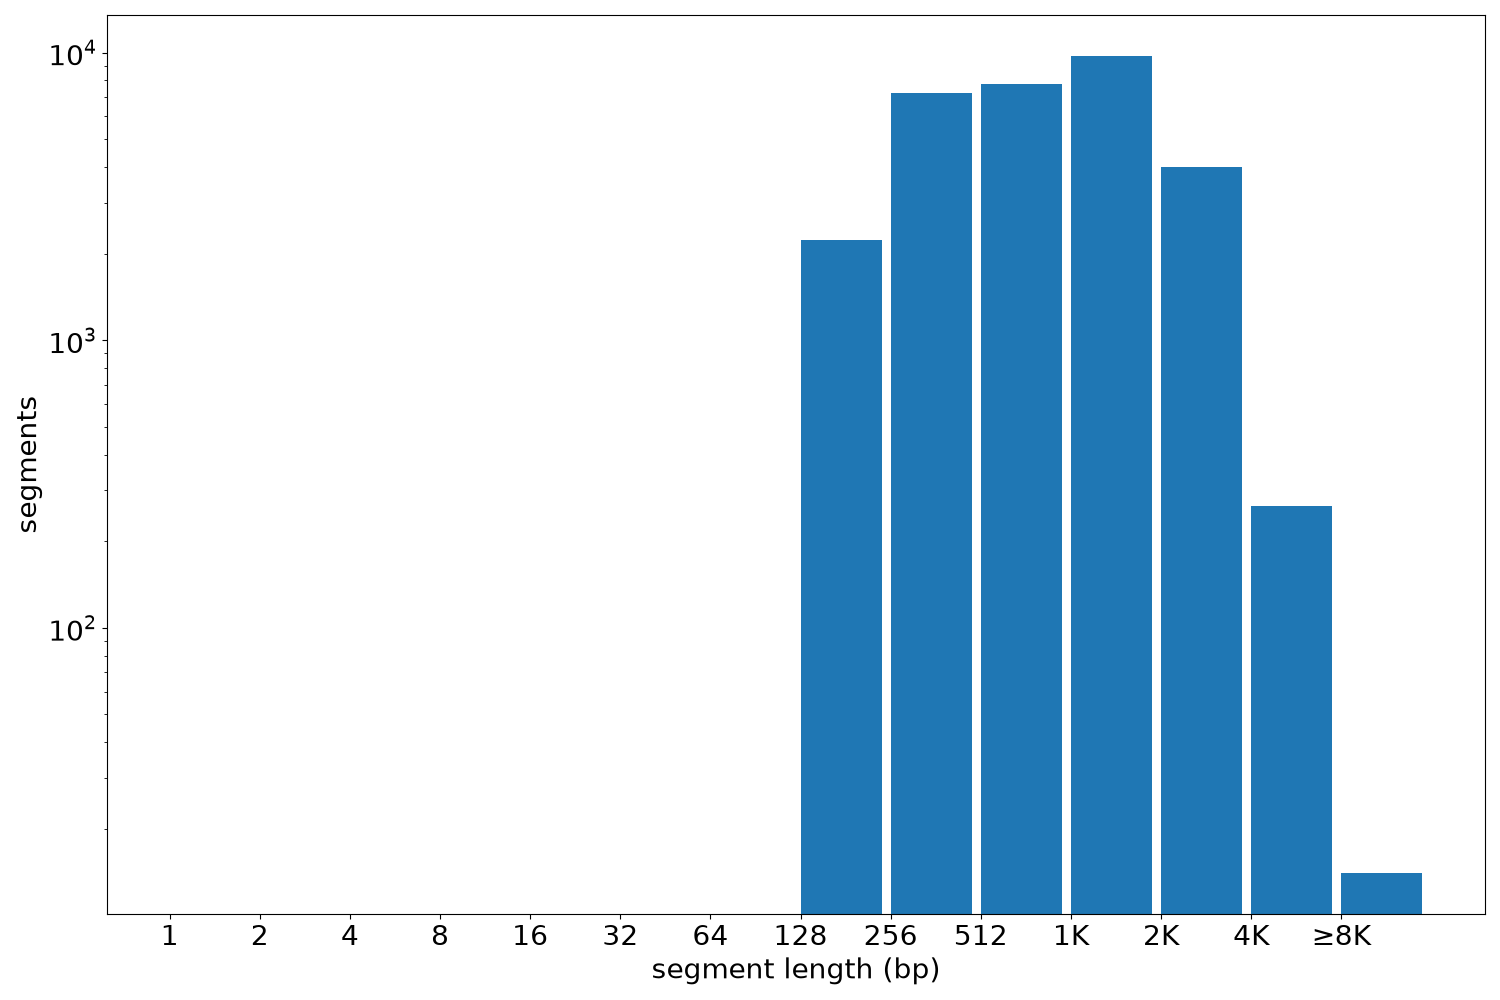
Segment lengths
| segments | min | max | mean | median | |
|---|---|---|---|---|---|
| segments | 31268 | 185 | 25834 | 1132.82 | 900 |
Files
| Filename | Size | md5 |
|---|---|---|
| ENCFF285MTN.bed.gz | 851.55 KB | bddda281fe9f4fd6de7495ff07a6a133 |
| ENCFF285MTN.tabix.bed.gz | 362.18 KB | b3f6d3a949a00cec2e49e2dd7b2eeeaa |
| ENCFF285MTN.tabix.bed.gz.tbi | 174.9 KB | 1743693871a3d6baabf3cb0c9864c43c |
| genomic_resource.yaml | 5.16 KB | 0f03f9bb76d9686e84e850d413a1a222 |
| statistics/ |