Resource
| Id | Histone_ChIP-seq/ENCSR000DXJ |
|---|---|
| Type | position_score |
| Version | 0 |
| Summary | Histone_ChIP-seq ENCSR000DXJ [biosample_summary="Homo sapiens bronchial epithelial cell" and target="H3K4me3"] |
| Description |
status: released biological_replicates: Rep 1, Rep 2 summary: output_type: replicated peaks audit_internal_action: Archived analysis {ENCAN195UZK|/analyses/ENCAN195UZK/} has in progress subobject quality standard {encode3-histone-chip|/quality-standards/encode3-histone-chip/} audit_warning: Processed alignments file {ENCFF360NXO|/files/ENCFF360NXO/} processed by ChIP-seq ENCODE3 hg19 pipeline has 10733133 usable fragments. The minimum ENCODE standard for each replicate in a ChIP-seq experiment targeting H3K4me3-human and investigated as a narrow histone mark is 10 million usable fragments. The recommended value is > 20 million, but > 10 million is acceptable. (See {ENCODE ChIP-seq data standards|/data-standards/chip-seq/}) audit_warning: Processed alignments file {ENCFF463GGH|/files/ENCFF463GGH/} processed by ChIP-seq ENCODE3 hg19 pipeline has 11469246 usable fragments. The minimum ENCODE standard for each replicate in a ChIP-seq experiment targeting H3K4me3-human and investigated as a narrow histone mark is 10 million usable fragments. The recommended value is > 20 million, but > 10 million is acceptable. (See {ENCODE ChIP-seq data standards|/data-standards/chip-seq/}) audit_warning: PBC1 (PCR Bottlenecking Coefficient 1, M1/M_distinct) is the ratio of the number of genomic locations where exactly one read maps uniquely (M1) to the number of genomic locations where some reads map (M_distinct). A PBC1 value in the range 0 - 0.5 is severe bottlenecking, 0.5 - 0.8 is moderate bottlenecking, 0.8 - 0.9 is mild bottlenecking, and > 0.9 is no bottlenecking. PBC1 value > 0.9 is recommended, but > 0.8 is acceptable. ENCODE processed alignments file {ENCFF360NXO|/files/ENCFF360NXO/} processed by ChIP-seq ENCODE3 hg19 pipeline was generated from a library with PBC1 value of 0.87. audit_warning: PBC2 (PCR Bottlenecking Coefficient 2, M1/M2) is the ratio of the number of genomic locations where exactly one read maps uniquely (M1) to the number of genomic locations where two reads map uniquely (M2). A PBC2 value in the range 0 - 1 is severe bottlenecking, 1 - 3 is moderate bottlenecking, 3 - 10 is mild bottlenecking, > 10 is no bottlenecking. PBC2 value > 10 is recommended, but > 3 is acceptable. ENCODE processed alignments file {ENCFF360NXO|/files/ENCFF360NXO/} processed by ChIP-seq ENCODE3 hg19 pipeline was generated from a library with PBC2 value of 7.89. audit_warning: PBC1 (PCR Bottlenecking Coefficient 1, M1/M_distinct) is the ratio of the number of genomic locations where exactly one read maps uniquely (M1) to the number of genomic locations where some reads map (M_distinct). A PBC1 value in the range 0 - 0.5 is severe bottlenecking, 0.5 - 0.8 is moderate bottlenecking, 0.8 - 0.9 is mild bottlenecking, and > 0.9 is no bottlenecking. PBC1 value > 0.9 is recommended, but > 0.8 is acceptable. ENCODE processed alignments file {ENCFF463GGH|/files/ENCFF463GGH/} processed by ChIP-seq ENCODE3 hg19 pipeline was generated from a library with PBC1 value of 0.87. audit_warning: PBC2 (PCR Bottlenecking Coefficient 2, M1/M2) is the ratio of the number of genomic locations where exactly one read maps uniquely (M1) to the number of genomic locations where two reads map uniquely (M2). A PBC2 value in the range 0 - 1 is severe bottlenecking, 1 - 3 is moderate bottlenecking, 3 - 10 is mild bottlenecking, > 10 is no bottlenecking. PBC2 value > 10 is recommended, but > 3 is acceptable. ENCODE processed alignments file {ENCFF463GGH|/files/ENCFF463GGH/} processed by ChIP-seq ENCODE3 hg19 pipeline was generated from a library with PBC2 value of 8.05. |
| Labels |
|
Scores (1)
| ID | Type | Default annotation | Description | Histogram | Range | Summary |
|---|---|---|---|---|---|---|
| Histone_ChIP-seq_ENCSR000DXJ | float |
Histone_ChIP-seq_ENCSR000DXJ |
Histone_ChIP-seq ENCSR000DXJ [biosample_summary="Homo sapiens bronchial epithelial cell" and target="H3K4me3"]
|
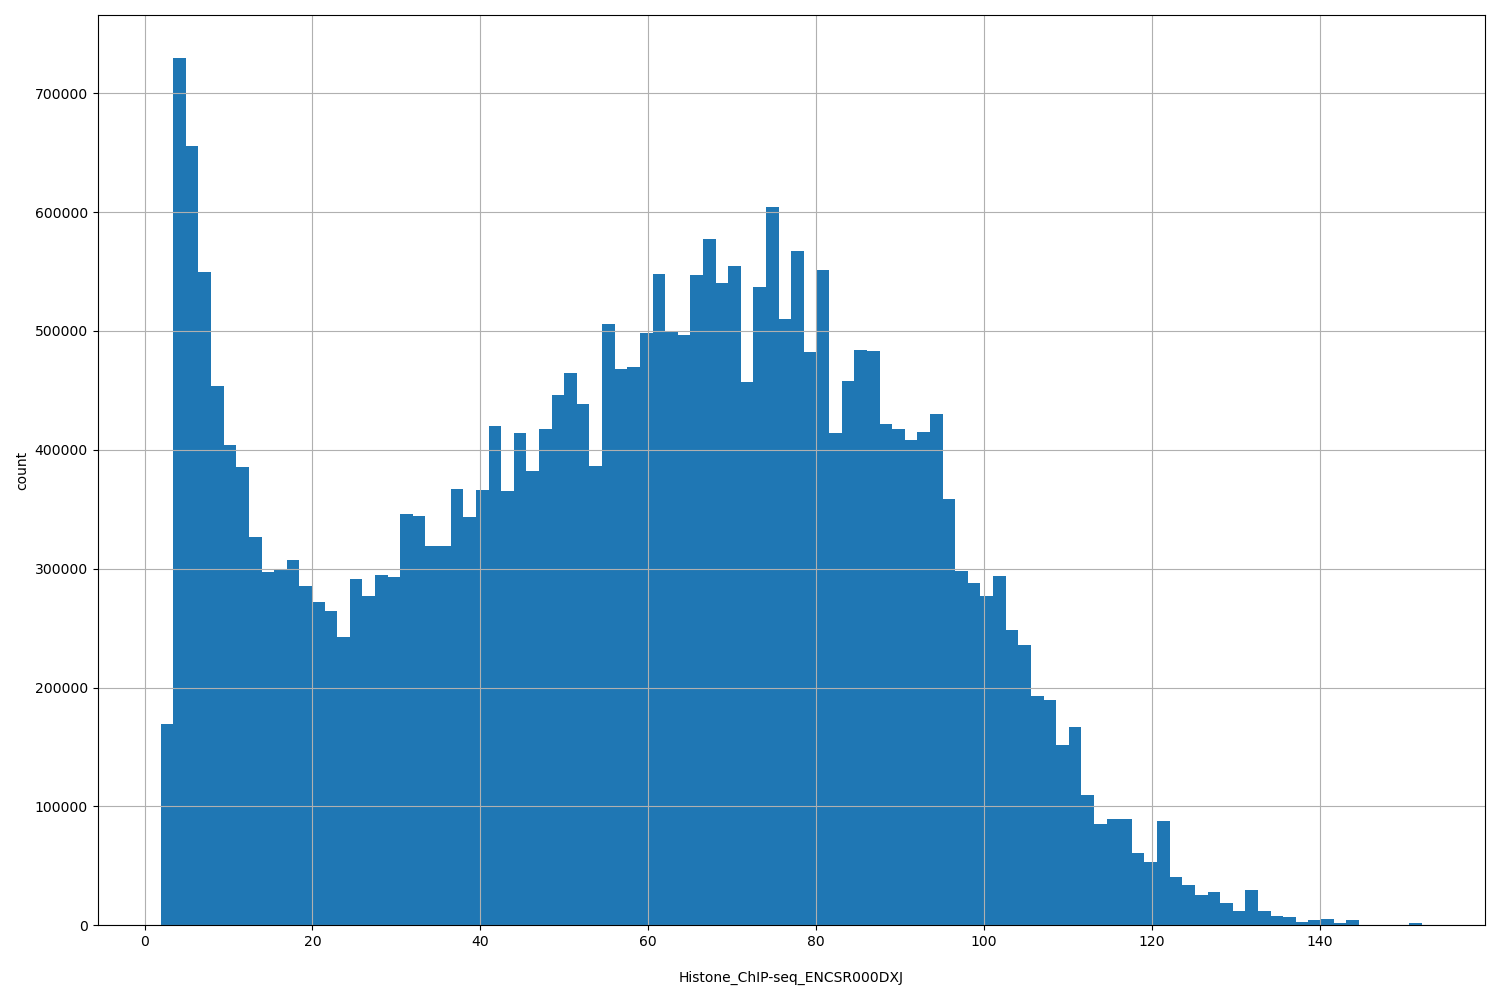 |
[1.91, 152] |
|
n counts base pairs; sd is the population standard deviation.
Coverage
| Chromosome | Covered positions | Covered % | Segments |
|---|---|---|---|
| all chromosomes | 29796930 | 0.93% | 23391 |
| chr1 | 2981605 | 1.20% | 2335 |
| chr2 | 2010572 | 0.83% | 1578 |
| chr3 | 1672688 | 0.84% | 1288 |
| chr4 | 1197941 | 0.63% | 895 |
| chr5 | 1381136 | 0.76% | 1034 |
| chr6 | 1770728 | 1.04% | 1311 |
| chr7 | 1371098 | 0.86% | 1103 |
| chr8 | 1100425 | 0.76% | 849 |
| chr9 | 1237037 | 0.89% | 963 |
| chr10 | 1227670 | 0.92% | 962 |
| chr11 | 1616321 | 1.20% | 1260 |
| chr12 | 1535671 | 1.15% | 1169 |
| chr13 | 585542 | 0.51% | 465 |
| chr14 | 1021604 | 0.95% | 784 |
| chr15 | 951269 | 0.93% | 743 |
| chr16 | 1187516 | 1.31% | 963 |
| chr17 | 1740219 | 2.09% | 1400 |
| chr18 | 527763 | 0.66% | 407 |
| chr19 | 1933626 | 3.30% | 1663 |
| chr20 | 775312 | 1.20% | 603 |
| chr21 | 312664 | 0.67% | 253 |
| chr22 | 663330 | 1.31% | 557 |
| chrX | 953443 | 0.61% | 779 |
| chrY | 41750 | 0.07% | 27 |
| 3342 contigs with no values (129077085 bp) | 0 | 0.00% | 0 |
Segment lengths
| segments | min | max | mean | median | |
|---|---|---|---|---|---|
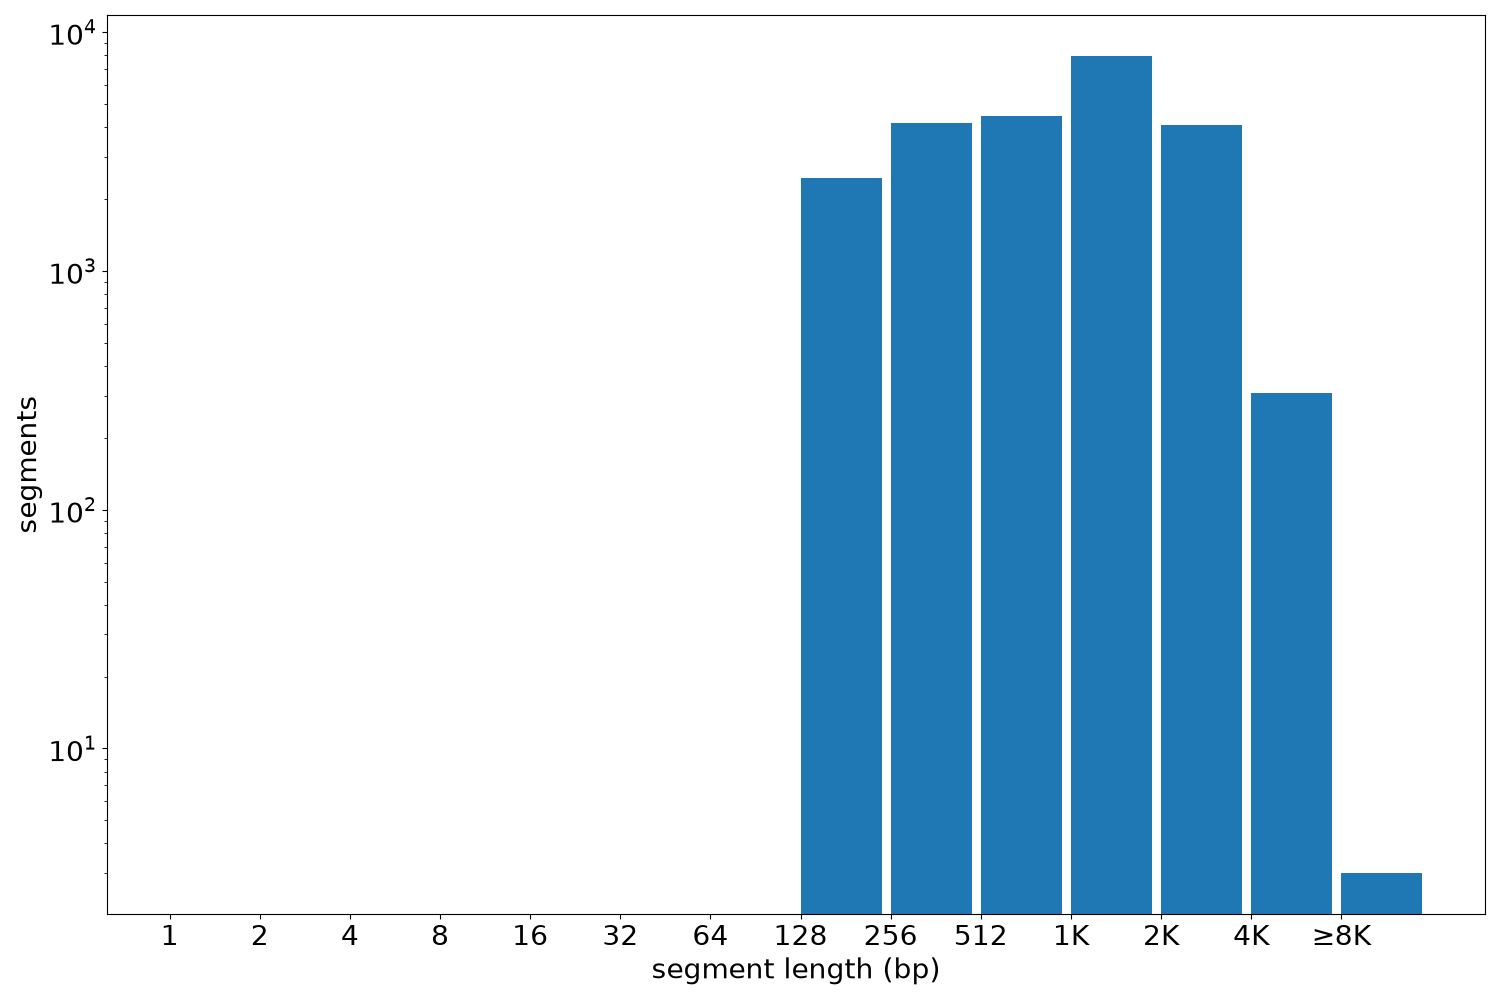
| segments | 23391 | 165 | 9186 | 1273.86 | 1105 |
Files
| Filename | Size | md5 |
|---|---|---|
| ENCFF772YDC.bed.gz | 648.17 KB | 2a16853fdfc1704145610914a8efc124 |
| ENCFF772YDC.tabix.bed.gz | 274.51 KB | 4519295b7434349757e1cc2221b435a0 |
| ENCFF772YDC.tabix.bed.gz.tbi | 143.24 KB | 05b57acd9c5dc0a8fcd994b37b0570f9 |
| genomic_resource.yaml | 5.31 KB | 17d8cea53da77c444ab626359f9a9f15 |
| statistics/ |