Resource
| Id | Histone_ChIP-seq/ENCSR000DTT |
|---|---|
| Type | position_score |
| Version | 0 |
| Summary | Histone_ChIP-seq ENCSR000DTT [biosample_summary="Homo sapiens epithelial cell of esophagus" and target="H3K4me3"] |
| Description |
status: released biological_replicates: Rep 1, Rep 2 summary: output_type: replicated peaks audit_internal_action: Archived analysis {ENCAN126MGS|/analyses/ENCAN126MGS/} has in progress subobject quality standard {encode3-histone-chip|/quality-standards/encode3-histone-chip/} audit_warning: PBC1 (PCR Bottlenecking Coefficient 1, M1/M_distinct) is the ratio of the number of genomic locations where exactly one read maps uniquely (M1) to the number of genomic locations where some reads map (M_distinct). A PBC1 value in the range 0 - 0.5 is severe bottlenecking, 0.5 - 0.8 is moderate bottlenecking, 0.8 - 0.9 is mild bottlenecking, and > 0.9 is no bottlenecking. PBC1 value > 0.9 is recommended, but > 0.8 is acceptable. ENCODE processed alignments file {ENCFF519BSD|/files/ENCFF519BSD/} processed by ChIP-seq ENCODE3 hg19 pipeline was generated from a library with PBC1 value of 0.83. audit_warning: PBC2 (PCR Bottlenecking Coefficient 2, M1/M2) is the ratio of the number of genomic locations where exactly one read maps uniquely (M1) to the number of genomic locations where two reads map uniquely (M2). A PBC2 value in the range 0 - 1 is severe bottlenecking, 1 - 3 is moderate bottlenecking, 3 - 10 is mild bottlenecking, > 10 is no bottlenecking. PBC2 value > 10 is recommended, but > 3 is acceptable. ENCODE processed alignments file {ENCFF519BSD|/files/ENCFF519BSD/} processed by ChIP-seq ENCODE3 hg19 pipeline was generated from a library with PBC2 value of 6.42. audit_warning: PBC1 (PCR Bottlenecking Coefficient 1, M1/M_distinct) is the ratio of the number of genomic locations where exactly one read maps uniquely (M1) to the number of genomic locations where some reads map (M_distinct). A PBC1 value in the range 0 - 0.5 is severe bottlenecking, 0.5 - 0.8 is moderate bottlenecking, 0.8 - 0.9 is mild bottlenecking, and > 0.9 is no bottlenecking. PBC1 value > 0.9 is recommended, but > 0.8 is acceptable. ENCODE processed alignments file {ENCFF275LFR|/files/ENCFF275LFR/} processed by ChIP-seq ENCODE3 hg19 pipeline was generated from a library with PBC1 value of 0.83. audit_warning: PBC2 (PCR Bottlenecking Coefficient 2, M1/M2) is the ratio of the number of genomic locations where exactly one read maps uniquely (M1) to the number of genomic locations where two reads map uniquely (M2). A PBC2 value in the range 0 - 1 is severe bottlenecking, 1 - 3 is moderate bottlenecking, 3 - 10 is mild bottlenecking, > 10 is no bottlenecking. PBC2 value > 10 is recommended, but > 3 is acceptable. ENCODE processed alignments file {ENCFF275LFR|/files/ENCFF275LFR/} processed by ChIP-seq ENCODE3 hg19 pipeline was generated from a library with PBC2 value of 6.73. |
| Labels |
|
Scores (1)
| ID | Type | Default annotation | Description | Histogram | Range | Summary |
|---|---|---|---|---|---|---|
| Histone_ChIP-seq_ENCSR000DTT | float |
Histone_ChIP-seq_ENCSR000DTT |
Histone_ChIP-seq ENCSR000DTT [biosample_summary="Homo sapiens epithelial cell of esophagus" and target="H3K4me3"]
|
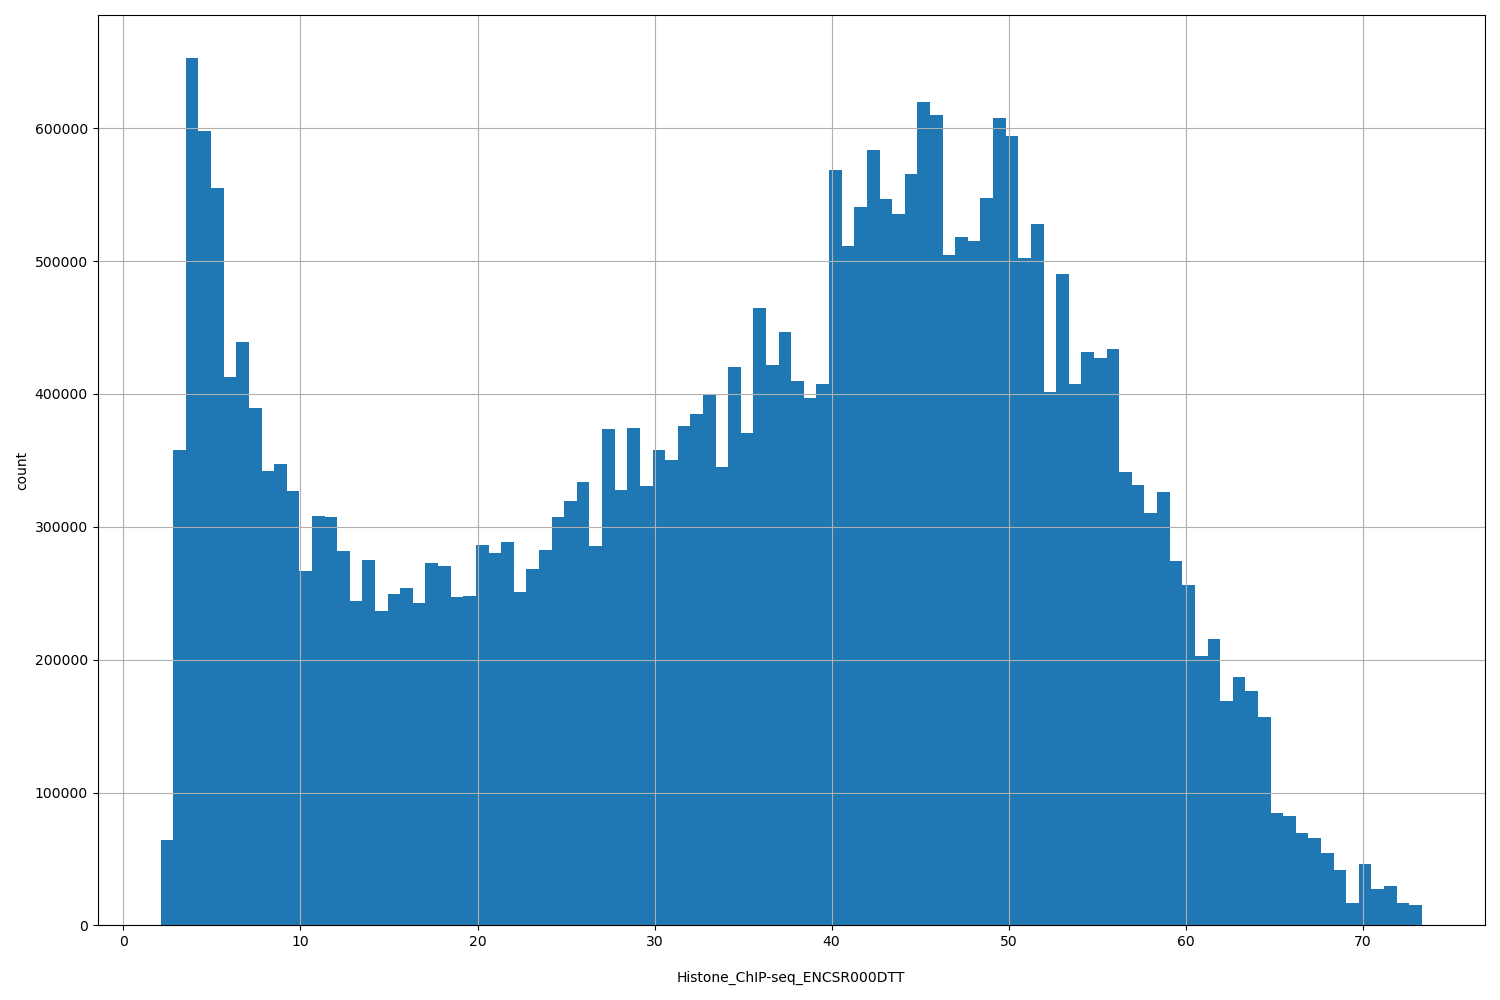 |
[2.1, 73.3] |
|
n counts base pairs; sd is the population standard deviation.
Coverage
| Chromosome | Covered positions | Covered % | Segments |
|---|---|---|---|
| all chromosomes | 33539543 | 1.04% | 29642 |
| chr1 | 3428228 | 1.38% | 2932 |
| chr2 | 2256990 | 0.93% | 1998 |
| chr3 | 1931905 | 0.97% | 1657 |
| chr4 | 1377174 | 0.72% | 1150 |
| chr5 | 1590612 | 0.88% | 1304 |
| chr6 | 2048226 | 1.20% | 1686 |
| chr7 | 1517093 | 0.95% | 1443 |
| chr8 | 1229987 | 0.85% | 1088 |
| chr9 | 1368646 | 0.99% | 1263 |
| chr10 | 1375544 | 1.03% | 1265 |
| chr11 | 1821568 | 1.35% | 1557 |
| chr12 | 1749074 | 1.31% | 1488 |
| chr13 | 675949 | 0.59% | 600 |
| chr14 | 1129851 | 1.06% | 974 |
| chr15 | 1080836 | 1.06% | 978 |
| chr16 | 1290286 | 1.43% | 1210 |
| chr17 | 1940858 | 2.33% | 1780 |
| chr18 | 589053 | 0.73% | 530 |
| chr19 | 2164216 | 3.69% | 1996 |
| chr20 | 864506 | 1.34% | 769 |
| chr21 | 343810 | 0.74% | 294 |
| chr22 | 705450 | 1.39% | 688 |
| chrX | 1010802 | 0.65% | 963 |
| chrY | 48879 | 0.09% | 29 |
| 3342 contigs with no values (129077085 bp) | 0 | 0.00% | 0 |
Segment lengths
| segments | min | max | mean | median | |
|---|---|---|---|---|---|
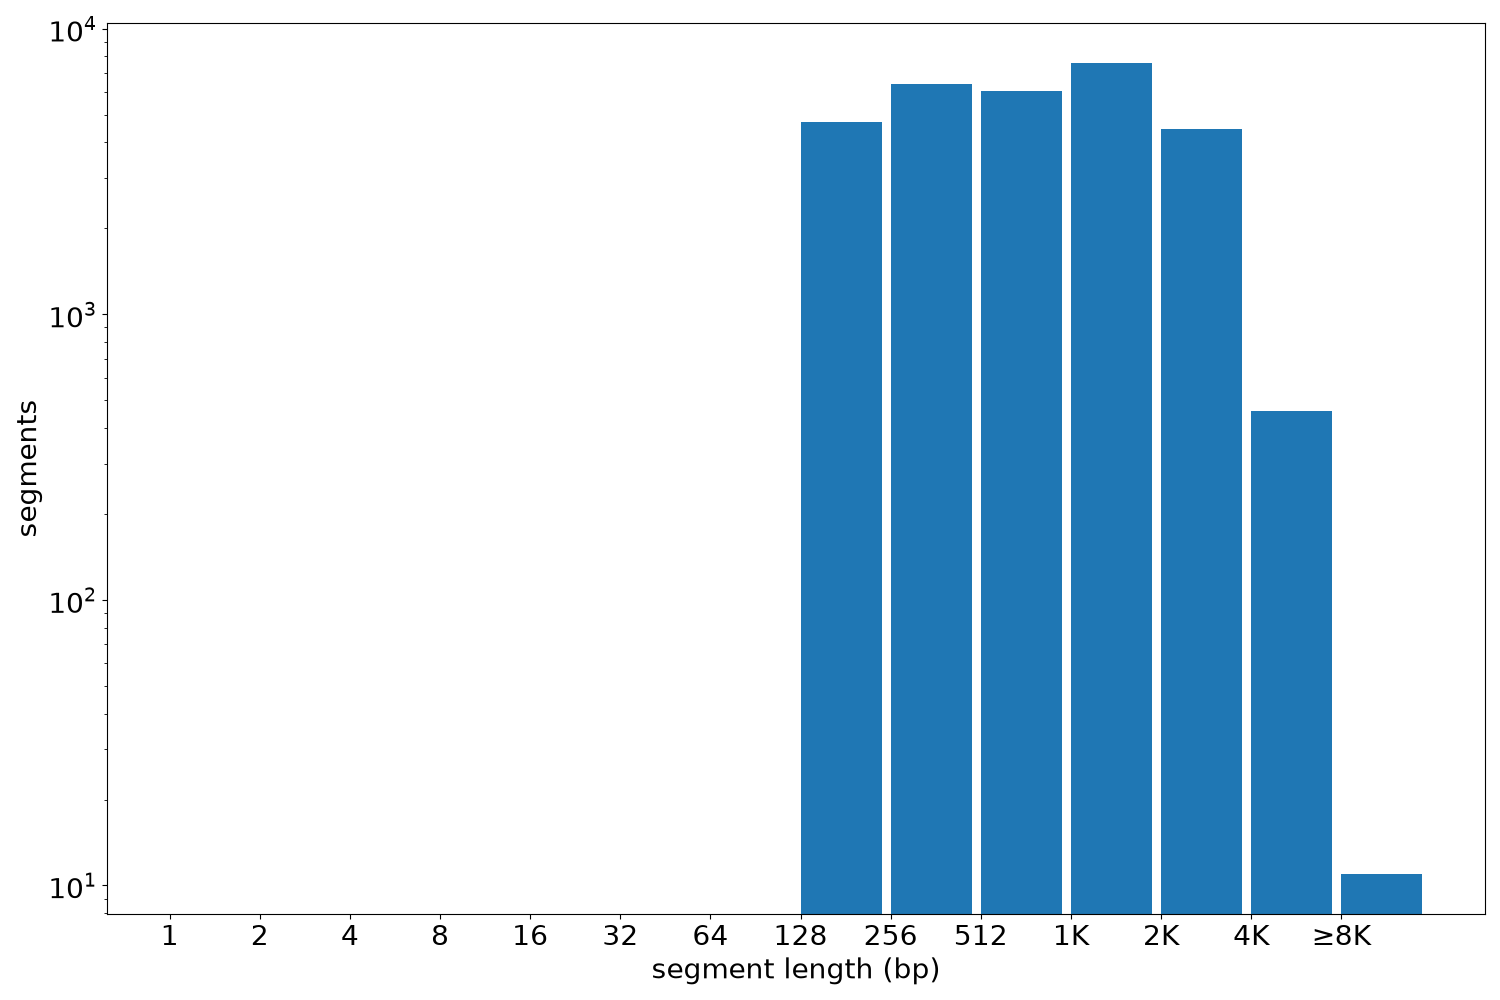
| segments | 29642 | 140 | 16969 | 1131.49 | 781 |
Files
| Filename | Size | md5 |
|---|---|---|
| ENCFF565PHW.bed.gz | 684.66 KB | d0dcc4d2f96ef23b73dcbc96f57e5897 |
| ENCFF565PHW.tabix.bed.gz | 327.44 KB | bfec96f54505f56e9e8a27099cacefac |
| ENCFF565PHW.tabix.bed.gz.tbi | 149.84 KB | c591071837c95e817934d09d3cc85071 |
| genomic_resource.yaml | 4.33 KB | 09b3cadddbc64128c402c90fca2d8041 |
| statistics/ |