Resource
| Id | Histone_ChIP-seq/ENCSR000ATI |
|---|---|
| Type | position_score |
| Version | 0 |
| Summary | Histone_ChIP-seq ENCSR000ATI [biosample_summary="Homo sapiens myotube originated from skeletal muscle myoblast" and target="H3K27me3"] |
| Description |
status: released biological_replicates: Rep 1, Rep 2 summary: male adult (22 years) output_type: replicated peaks audit_internal_action: Archived analysis {ENCAN986BIX|/analyses/ENCAN986BIX/} has in progress subobject quality standard {encode3-histone-chip|/quality-standards/encode3-histone-chip/} audit_not_compliant: Processed alignments file {ENCFF188KFL|/files/ENCFF188KFL/} processed by ChIP-seq ENCODE3 hg19 pipeline has 14475530 usable fragments. The minimum ENCODE standard for each replicate in a ChIP-seq experiment targeting H3K27me3-human and investigated as a broad histone mark is 20 million usable fragments. The recommended value is > 45 million, but > 35 million is acceptable. (See {ENCODE ChIP-seq data standards|/data-standards/chip-seq/}) audit_warning: PBC1 (PCR Bottlenecking Coefficient 1, M1/M_distinct) is the ratio of the number of genomic locations where exactly one read maps uniquely (M1) to the number of genomic locations where some reads map (M_distinct). A PBC1 value in the range 0 - 0.5 is severe bottlenecking, 0.5 - 0.8 is moderate bottlenecking, 0.8 - 0.9 is mild bottlenecking, and > 0.9 is no bottlenecking. PBC1 value > 0.9 is recommended, but > 0.8 is acceptable. ENCODE processed alignments file {ENCFF188KFL|/files/ENCFF188KFL/} processed by ChIP-seq ENCODE3 hg19 pipeline was generated from a library with PBC1 value of 0.89. audit_warning: PBC2 (PCR Bottlenecking Coefficient 2, M1/M2) is the ratio of the number of genomic locations where exactly one read maps uniquely (M1) to the number of genomic locations where two reads map uniquely (M2). A PBC2 value in the range 0 - 1 is severe bottlenecking, 1 - 3 is moderate bottlenecking, 3 - 10 is mild bottlenecking, > 10 is no bottlenecking. PBC2 value > 10 is recommended, but > 3 is acceptable. ENCODE processed alignments file {ENCFF188KFL|/files/ENCFF188KFL/} processed by ChIP-seq ENCODE3 hg19 pipeline was generated from a library with PBC2 value of 8.86. audit_warning: PBC1 (PCR Bottlenecking Coefficient 1, M1/M_distinct) is the ratio of the number of genomic locations where exactly one read maps uniquely (M1) to the number of genomic locations where some reads map (M_distinct). A PBC1 value in the range 0 - 0.5 is severe bottlenecking, 0.5 - 0.8 is moderate bottlenecking, 0.8 - 0.9 is mild bottlenecking, and > 0.9 is no bottlenecking. PBC1 value > 0.9 is recommended, but > 0.8 is acceptable. ENCODE processed alignments file {ENCFF379GQG|/files/ENCFF379GQG/} processed by ChIP-seq ENCODE3 hg19 pipeline was generated from a library with PBC1 value of 0.86. audit_warning: PBC2 (PCR Bottlenecking Coefficient 2, M1/M2) is the ratio of the number of genomic locations where exactly one read maps uniquely (M1) to the number of genomic locations where two reads map uniquely (M2). A PBC2 value in the range 0 - 1 is severe bottlenecking, 1 - 3 is moderate bottlenecking, 3 - 10 is mild bottlenecking, > 10 is no bottlenecking. PBC2 value > 10 is recommended, but > 3 is acceptable. ENCODE processed alignments file {ENCFF379GQG|/files/ENCFF379GQG/} processed by ChIP-seq ENCODE3 hg19 pipeline was generated from a library with PBC2 value of 7.27. |
| Labels |
|
Scores (1)
| ID | Type | Default annotation | Description | Histogram | Range | Summary |
|---|---|---|---|---|---|---|
| Histone_ChIP-seq_ENCSR000ATI | float |
Histone_ChIP-seq_ENCSR000ATI |
Histone_ChIP-seq ENCSR000ATI [biosample_summary="Homo sapiens myotube originated from skeletal muscle myoblast" and target="H3K27me3"]
|
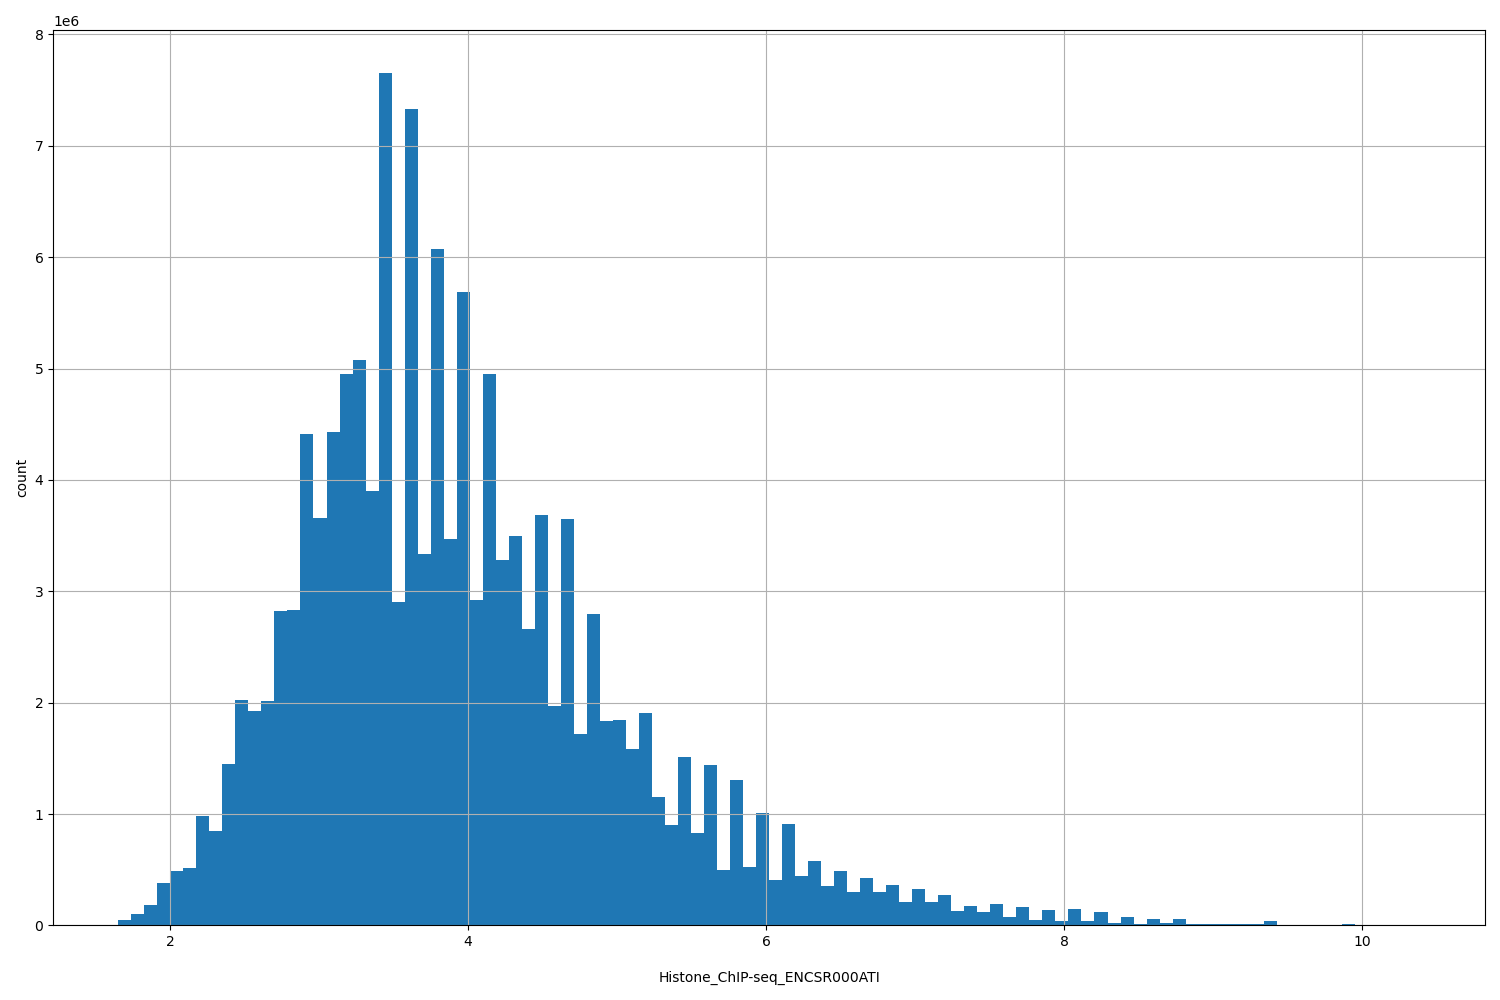 |
[1.65, 10.4] |
|
n counts base pairs; sd is the population standard deviation.
Coverage
| Chromosome | Covered positions | Covered % | Segments |
|---|---|---|---|
| all chromosomes | 134377550 | 4.18% | 215175 |
| chr1 | 12088071 | 4.86% | 19115 |
| chr2 | 11251024 | 4.65% | 18284 |
| chr3 | 8595485 | 4.33% | 14269 |
| chr4 | 6346219 | 3.34% | 11233 |
| chr5 | 7990565 | 4.40% | 13043 |
| chr6 | 8037853 | 4.71% | 13219 |
| chr7 | 6292571 | 3.95% | 10661 |
| chr8 | 6335758 | 4.37% | 10880 |
| chr9 | 6207195 | 4.49% | 9653 |
| chr10 | 7326321 | 5.48% | 11398 |
| chr11 | 9264448 | 6.86% | 13733 |
| chr12 | 6105958 | 4.58% | 9958 |
| chr13 | 3345569 | 2.93% | 5531 |
| chr14 | 4023146 | 3.76% | 6505 |
| chr15 | 4688915 | 4.60% | 7069 |
| chr16 | 3413061 | 3.78% | 5530 |
| chr17 | 5426382 | 6.52% | 7947 |
| chr18 | 3769684 | 4.69% | 6336 |
| chr19 | 2784701 | 4.75% | 4378 |
| chr20 | 6035545 | 9.37% | 8994 |
| chr21 | 1752143 | 3.75% | 2454 |
| chr22 | 2851265 | 5.61% | 3984 |
| chrX | 419449 | 0.27% | 939 |
| chrY | 26222 | 0.05% | 62 |
| 3342 contigs with no values (129077085 bp) | 0 | 0.00% | 0 |
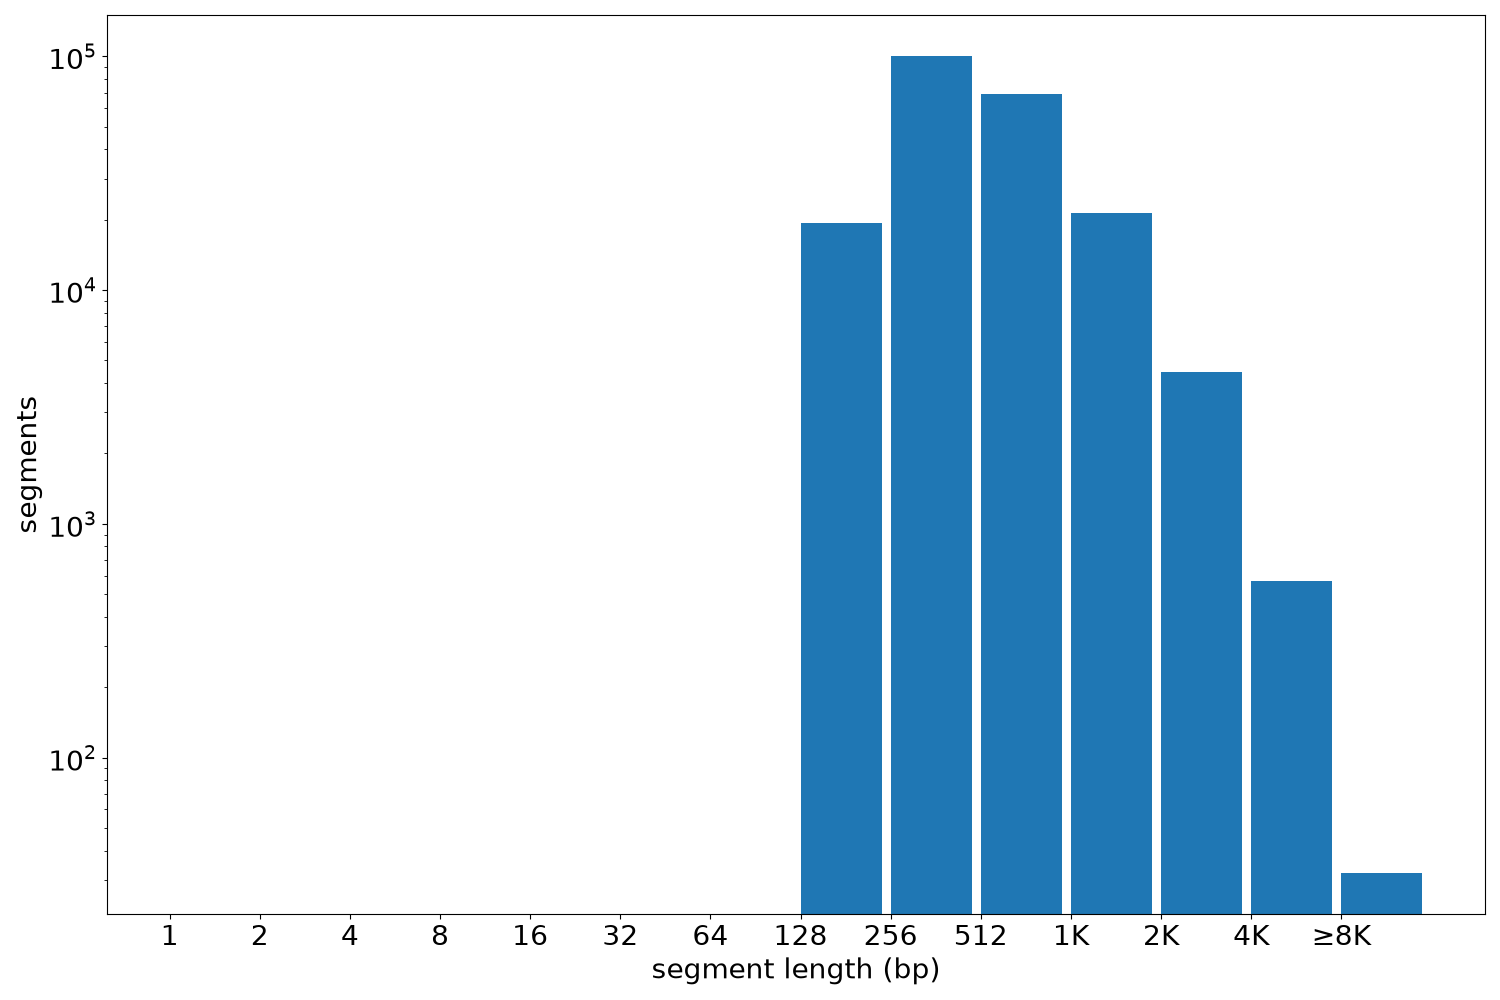
Segment lengths
| segments | min | max | mean | median | |
|---|---|---|---|---|---|
| segments | 215175 | 195 | 11300 | 624.5 | 471 |
Files
| Filename | Size | md5 |
|---|---|---|
| ENCFF585KRM.bed.gz | 4.22 MB | 06d8c64605bc33c02839814c84d77035 |
| ENCFF585KRM.tabix.bed.gz | 2.06 MB | 3383a785dfae9c8966dcf567a128e1af |
| ENCFF585KRM.tabix.bed.gz.tbi | 288.54 KB | 4c2a1322aaa374c3257b64a23570790d |
| genomic_resource.yaml | 4.52 KB | 41cd1351adccf0106b74a54c4c09fb2b |
| statistics/ |