Resource
| Id | Histone_ChIP-seq/ENCSR000ANW |
|---|---|
| Type | position_score |
| Version | 0 |
| Summary | Histone_ChIP-seq ENCSR000ANW [biosample_summary="Homo sapiens myotube originated from skeletal muscle myoblast" and target="H3K36me3"] |
| Description |
status: released biological_replicates: Rep 1, Rep 2 summary: male adult (22 years) output_type: replicated peaks audit_internal_action: Archived analysis {ENCAN028BGJ|/analyses/ENCAN028BGJ/} has in progress subobject quality standard {encode3-histone-chip|/quality-standards/encode3-histone-chip/} audit_not_compliant: Processed alignments file {ENCFF474VYS|/files/ENCFF474VYS/} processed by ChIP-seq ENCODE3 GRCh38 pipeline has 8941670 usable fragments. The minimum ENCODE standard for each replicate in a ChIP-seq experiment targeting H3K36me3-human and investigated as a broad histone mark is 20 million usable fragments. The recommended value is > 45 million, but > 35 million is acceptable. (See {ENCODE ChIP-seq data standards|/data-standards/chip-seq/}) audit_not_compliant: Processed alignments file {ENCFF576SHB|/files/ENCFF576SHB/} processed by ChIP-seq ENCODE3 GRCh38 pipeline has 11938952 usable fragments. The minimum ENCODE standard for each replicate in a ChIP-seq experiment targeting H3K36me3-human and investigated as a broad histone mark is 20 million usable fragments. The recommended value is > 45 million, but > 35 million is acceptable. (See {ENCODE ChIP-seq data standards|/data-standards/chip-seq/}) audit_warning: PBC1 (PCR Bottlenecking Coefficient 1, M1/M_distinct) is the ratio of the number of genomic locations where exactly one read maps uniquely (M1) to the number of genomic locations where some reads map (M_distinct). A PBC1 value in the range 0 - 0.5 is severe bottlenecking, 0.5 - 0.8 is moderate bottlenecking, 0.8 - 0.9 is mild bottlenecking, and > 0.9 is no bottlenecking. PBC1 value > 0.9 is recommended, but > 0.8 is acceptable. ENCODE processed alignments file {ENCFF474VYS|/files/ENCFF474VYS/} processed by ChIP-seq ENCODE3 GRCh38 pipeline was generated from a library with PBC1 value of 0.90. audit_warning: PBC1 (PCR Bottlenecking Coefficient 1, M1/M_distinct) is the ratio of the number of genomic locations where exactly one read maps uniquely (M1) to the number of genomic locations where some reads map (M_distinct). A PBC1 value in the range 0 - 0.5 is severe bottlenecking, 0.5 - 0.8 is moderate bottlenecking, 0.8 - 0.9 is mild bottlenecking, and > 0.9 is no bottlenecking. PBC1 value > 0.9 is recommended, but > 0.8 is acceptable. ENCODE processed alignments file {ENCFF576SHB|/files/ENCFF576SHB/} processed by ChIP-seq ENCODE3 GRCh38 pipeline was generated from a library with PBC1 value of 0.87. audit_warning: PBC2 (PCR Bottlenecking Coefficient 2, M1/M2) is the ratio of the number of genomic locations where exactly one read maps uniquely (M1) to the number of genomic locations where two reads map uniquely (M2). A PBC2 value in the range 0 - 1 is severe bottlenecking, 1 - 3 is moderate bottlenecking, 3 - 10 is mild bottlenecking, > 10 is no bottlenecking. PBC2 value > 10 is recommended, but > 3 is acceptable. ENCODE processed alignments file {ENCFF576SHB|/files/ENCFF576SHB/} processed by ChIP-seq ENCODE3 GRCh38 pipeline was generated from a library with PBC2 value of 7.59. |
| Labels |
|
Scores (1)
| ID | Type | Default annotation | Description | Histogram | Range | Summary |
|---|---|---|---|---|---|---|
| Histone_ChIP-seq_ENCSR000ANW | float |
Histone_ChIP-seq_ENCSR000ANW |
Histone_ChIP-seq ENCSR000ANW [biosample_summary="Homo sapiens myotube originated from skeletal muscle myoblast" and target="H3K36me3"]
|
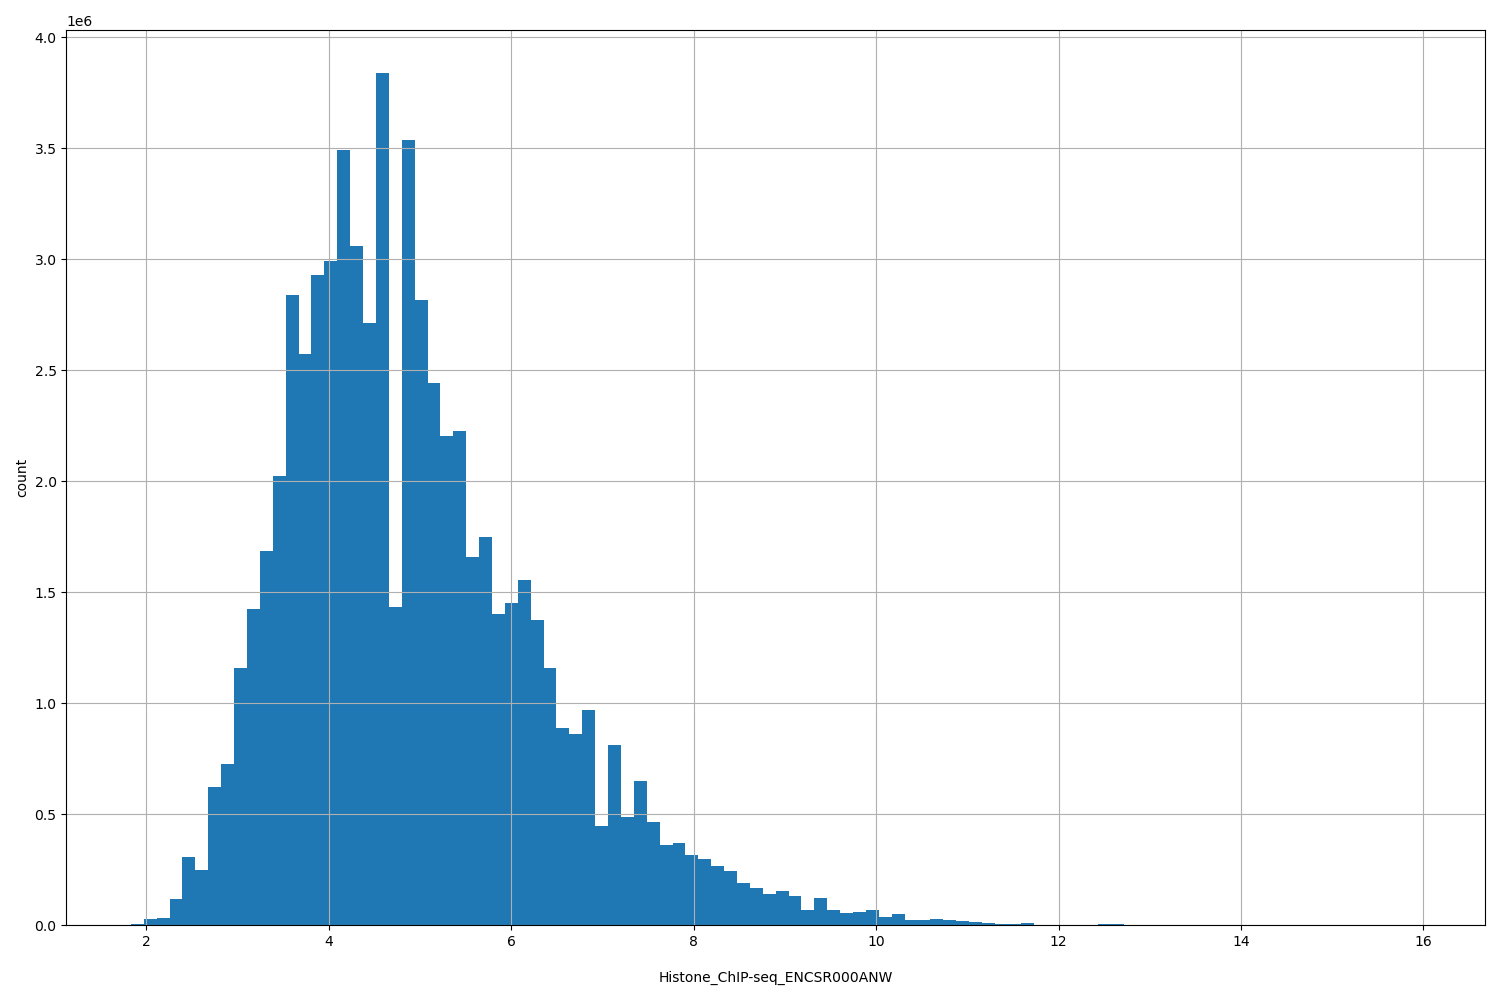 |
[1.83, 16] |
|
n counts base pairs; sd is the population standard deviation.
Coverage
| Chromosome | Covered positions | Covered % | Segments |
|---|---|---|---|
| all chromosomes | 66785543 | 2.08% | 101470 |
| chr1 | 6718480 | 2.70% | 9749 |
| chr2 | 5697401 | 2.35% | 8732 |
| chr3 | 4222777 | 2.13% | 6585 |
| chr4 | 2833026 | 1.49% | 4535 |
| chr5 | 3408827 | 1.88% | 5290 |
| chr6 | 3263473 | 1.91% | 5211 |
| chr7 | 2810349 | 1.76% | 4403 |
| chr8 | 2026718 | 1.40% | 3362 |
| chr9 | 2927900 | 2.12% | 4324 |
| chr10 | 3074726 | 2.30% | 4840 |
| chr11 | 3465260 | 2.57% | 4989 |
| chr12 | 3836866 | 2.88% | 5631 |
| chr13 | 1570847 | 1.37% | 2529 |
| chr14 | 2219235 | 2.07% | 3411 |
| chr15 | 2834865 | 2.78% | 4086 |
| chr16 | 2690633 | 2.98% | 4060 |
| chr17 | 3585251 | 4.31% | 5223 |
| chr18 | 1076264 | 1.34% | 1833 |
| chr19 | 3153282 | 5.38% | 4604 |
| chr20 | 1879934 | 2.92% | 2758 |
| chr21 | 906368 | 1.94% | 1328 |
| chr22 | 1707642 | 3.36% | 2356 |
| chrX | 829656 | 0.53% | 1542 |
| chrY | 45763 | 0.08% | 89 |
| 3342 contigs with no values (129077085 bp) | 0 | 0.00% | 0 |
Segment lengths
| segments | min | max | mean | median | |
|---|---|---|---|---|---|
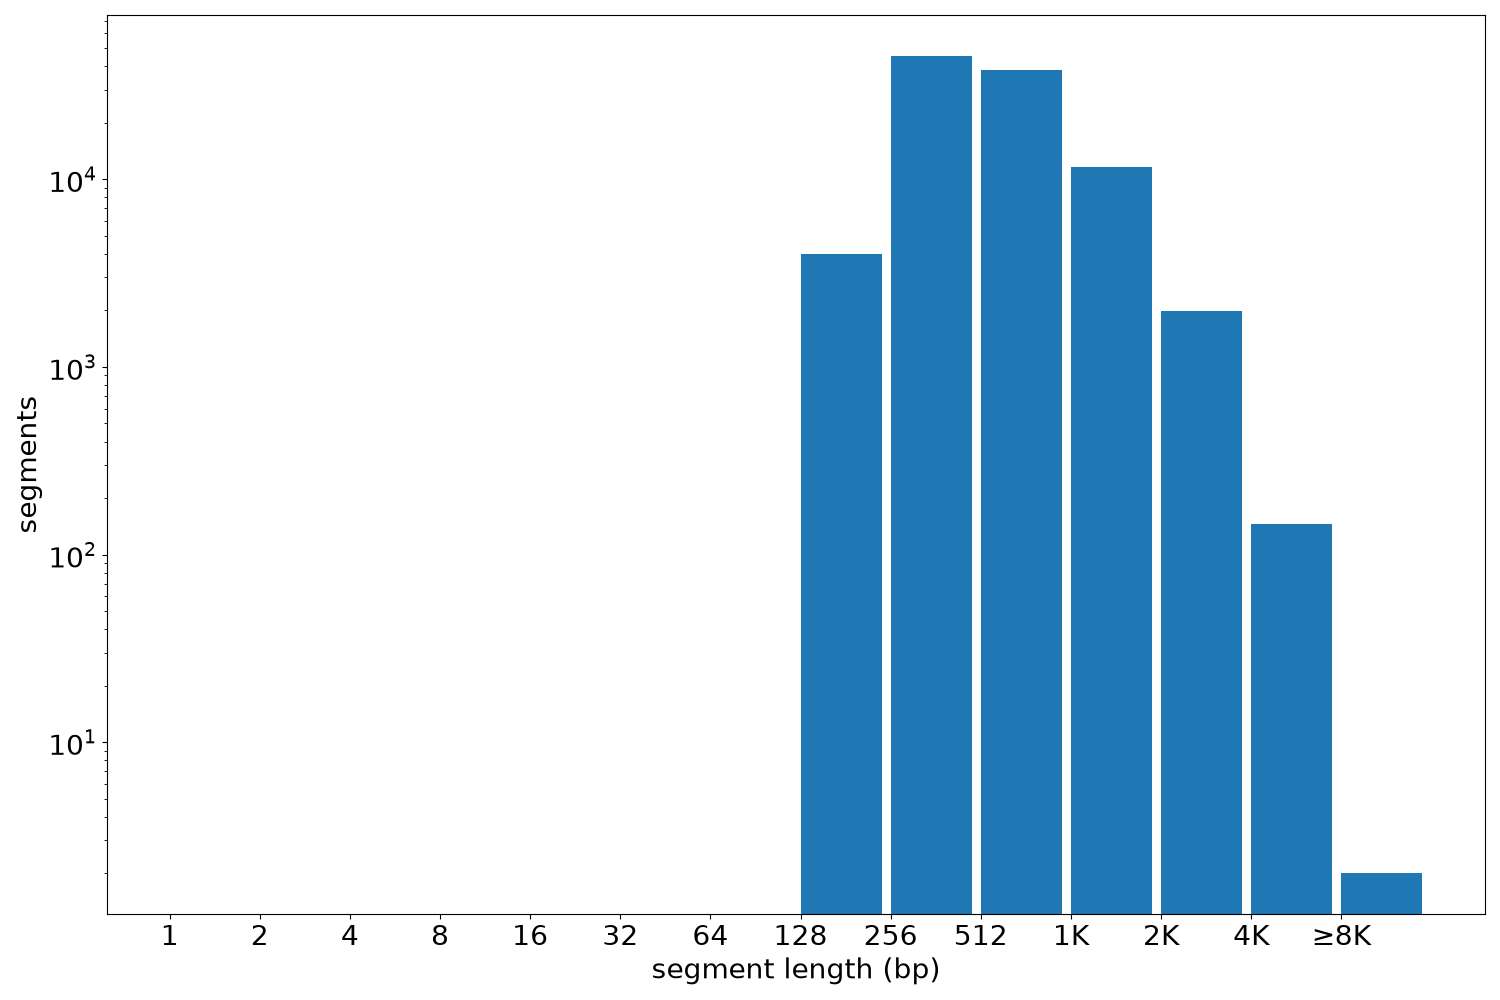
| segments | 101470 | 210 | 9169 | 658.18 | 521 |
Files
| Filename | Size | md5 |
|---|---|---|
| ENCFF286CTR.bed.gz | 2.12 MB | 6e002b51c9e0e2633d494426f264693e |
| ENCFF286CTR.tabix.bed.gz | 1.01 MB | 839ab56f06ce16844d8843b66d4f99b6 |
| ENCFF286CTR.tabix.bed.gz.tbi | 177.42 KB | d46712a9b80ec8f2dc0edef1ac319416 |
| genomic_resource.yaml | 4.4 KB | 61ba010ae8aacd44735d2fd7c44830cf |
| statistics/ |