Resource
| Id | DNase-seq/ENCSR963ALV |
|---|---|
| Type | position_score |
| Version | 0 |
| Summary | DNase-seq ENCSR963ALV [biosample_summary="Homo sapiens neural progenitor cell originated from H9"] |
| Description |
status: released biological_replicates: Rep 2 summary: female embryo (5 days) output_type: peaks audit_warning: Signal Portion of Tags (SPOT) is a measure of enrichment, analogous to the commonly used fraction of reads in peaks metric. ENCODE processed alignment files {ENCFF123YLB|/files/ENCFF123YLB/} processed by DNase-seq ENCODE4 v3.0.0-alpha.2 GRCh38 pipeline ({ENCPL848KLD|/pipelines/ENCPL848KLD/}) for GRCh38 assembly have a SPOT1 score of 0.34. According to ENCODE standards, SPOT1 score of 0.4 or higher is considered a product of high quality data. Any sample with a SPOT1 score <0.3 should be targeted for replacement with a higher quality sample, and a SPOT1 score of 0.25 is considered minimally acceptable SPOT1 score of 0.25 is considered minimally acceptable for rare and hard to find primary tissues. (See {ENCODE DNase-seq data standards|/data-standards/dnase-seq-encode4/}) |
| Labels |
|
Scores (1)
| ID | Type | Default annotation | Description | Histogram | Range | Summary |
|---|---|---|---|---|---|---|
| DNase-seq_ENCSR963ALV | float |
DNase-seq_ENCSR963ALV |
DNase-seq ENCSR963ALV [biosample_summary="Homo sapiens neural progenitor cell originated from H9"]
|
 |
[0.0237, 46.8] |
|
n counts base pairs; sd is the population standard deviation.
Coverage
| Chromosome | Covered positions | Covered % | Segments |
|---|---|---|---|
| all chromosomes | 34702208 | 1.08% | 182743 |
| chr1 | 3132950 | 1.26% | 16307 |
| chr2 | 2671448 | 1.10% | 14210 |
| chr3 | 2098464 | 1.06% | 11270 |
| chr4 | 1723480 | 0.91% | 9334 |
| chr5 | 1926663 | 1.06% | 10352 |
| chr6 | 1989778 | 1.16% | 10640 |
| chr7 | 1770954 | 1.11% | 9422 |
| chr8 | 1557245 | 1.07% | 8351 |
| chr9 | 1520464 | 1.10% | 7951 |
| chr10 | 1636542 | 1.22% | 8679 |
| chr11 | 1839929 | 1.36% | 9605 |
| chr12 | 1684201 | 1.26% | 8829 |
| chr13 | 908672 | 0.79% | 4904 |
| chr14 | 1118009 | 1.04% | 5815 |
| chr15 | 1116755 | 1.09% | 5796 |
| chr16 | 1218442 | 1.35% | 6299 |
| chr17 | 1571273 | 1.89% | 7934 |
| chr18 | 784869 | 0.98% | 4227 |
| chr19 | 1319360 | 2.25% | 6522 |
| chr20 | 942070 | 1.46% | 4883 |
| chr21 | 357525 | 0.77% | 1917 |
| chr22 | 668325 | 1.32% | 3442 |
| chrX | 1142940 | 0.73% | 6040 |
| chrY | 1850 | <0.01% | 14 |
| 3342 contigs with no values (129077085 bp) | 0 | 0.00% | 0 |
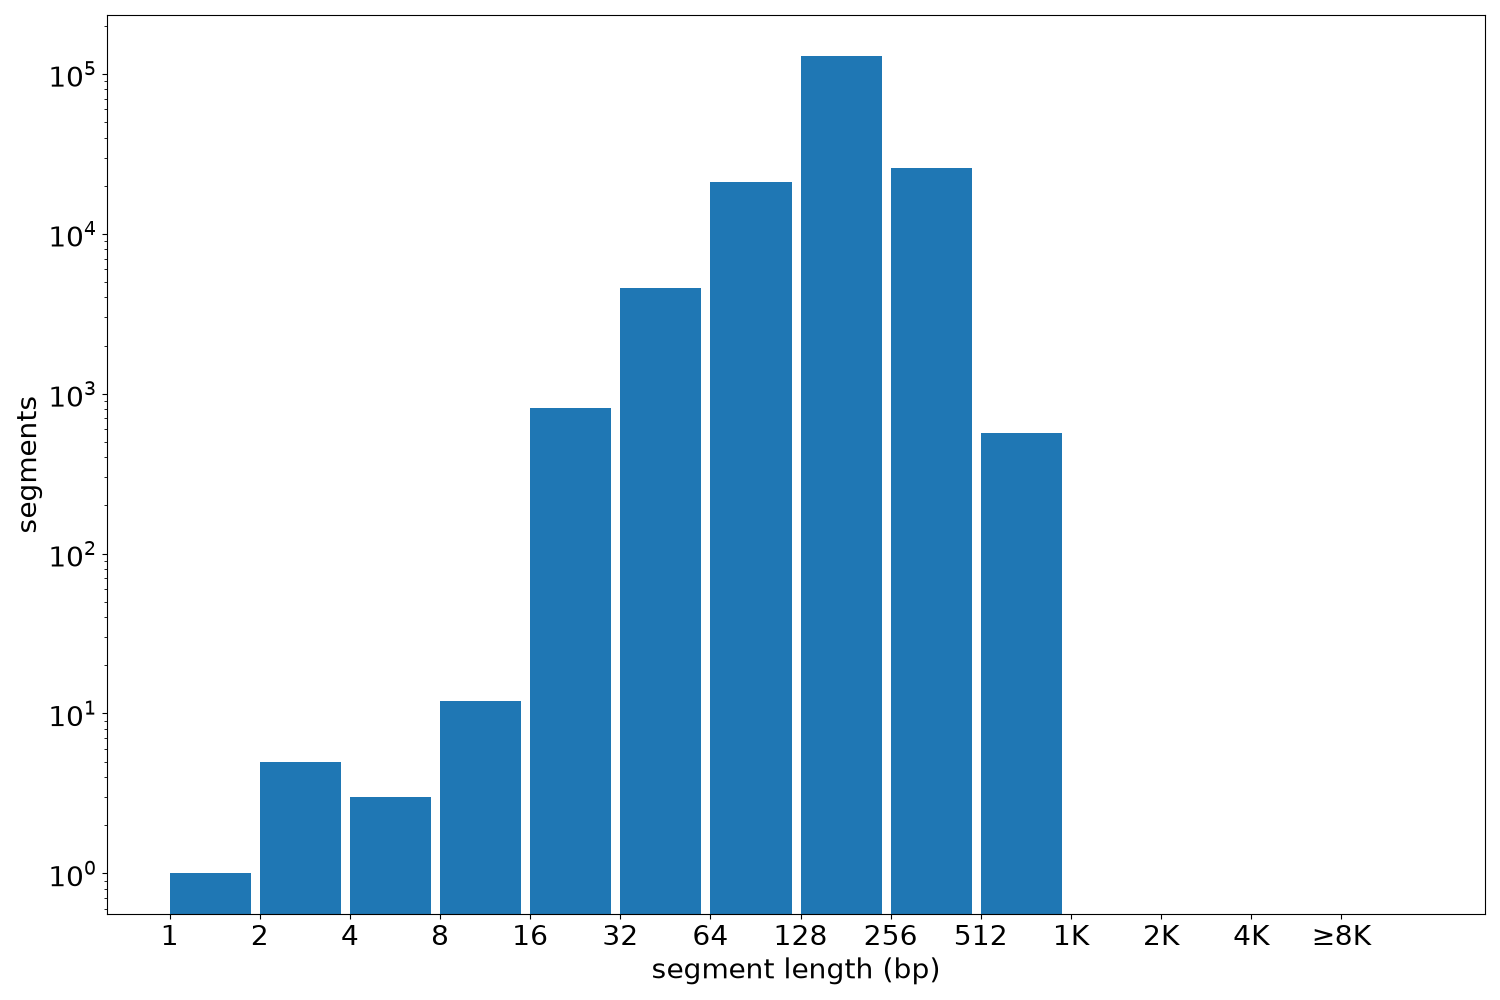
Segment lengths
| segments | min | max | mean | median | |
|---|---|---|---|---|---|
| segments | 182743 | 1 | 800 | 189.9 | 180 |
Files
| Filename | Size | md5 |
|---|---|---|
| ENCFF502QXW.bed.gz | 1.99 MB | 5f8d3825b28f4d4fece539762b90ba07 |
| ENCFF502QXW.tabix.bed.gz | 1.82 MB | 30baaf09b266ee12c92b23fd840346d5 |
| ENCFF502QXW.tabix.bed.gz.tbi | 624.83 KB | c823db151687588aec4c9e3ded7f3b4c |
| genomic_resource.yaml | 2.31 KB | 93428d3a7702c9ce908fa79d2cbad0e5 |
| statistics/ |