Resource
| Id | DNase-seq/ENCSR951BNY |
|---|---|
| Type | position_score |
| Version | 0 |
| Summary | DNase-seq ENCSR951BNY [biosample_summary="Homo sapiens H1"] |
| Description |
status: released biological_replicates: Rep 1 summary: output_type: peaks audit_warning: Signal Portion of Tags (SPOT) is a measure of enrichment, analogous to the commonly used fraction of reads in peaks metric. ENCODE processed alignment files {ENCFF801RHD|/files/ENCFF801RHD/} processed by DNase-seq ENCODE4 v3.0.0 GRCh38 pipeline ({ENCPL848KLD|/pipelines/ENCPL848KLD/}) for GRCh38 assembly have a SPOT1 score of 0.32. According to ENCODE standards, SPOT1 score of 0.4 or higher is considered a product of high quality data. Any sample with a SPOT1 score <0.3 should be targeted for replacement with a higher quality sample, and a SPOT1 score of 0.25 is considered minimally acceptable SPOT1 score of 0.25 is considered minimally acceptable for rare and hard to find primary tissues. (See {ENCODE DNase-seq data standards|/data-standards/dnase-seq-encode4/}) audit_warning: Signal Portion of Tags (SPOT) is a measure of enrichment, analogous to the commonly used fraction of reads in peaks metric. ENCODE processed alignment files {ENCFF579KRZ|/files/ENCFF579KRZ/} processed by DNase-seq ENCODE4 v3.0.0 GRCh38 pipeline ({ENCPL848KLD|/pipelines/ENCPL848KLD/}) for GRCh38 assembly have a SPOT1 score of 0.39. According to ENCODE standards, SPOT1 score of 0.4 or higher is considered a product of high quality data. Any sample with a SPOT1 score <0.3 should be targeted for replacement with a higher quality sample, and a SPOT1 score of 0.25 is considered minimally acceptable SPOT1 score of 0.25 is considered minimally acceptable for rare and hard to find primary tissues. (See {ENCODE DNase-seq data standards|/data-standards/dnase-seq-encode4/}) |
| Labels |
|
Scores (1)
| ID | Type | Default annotation | Description | Histogram | Range | Summary |
|---|---|---|---|---|---|---|
| DNase-seq_ENCSR951BNY | float |
DNase-seq_ENCSR951BNY |
DNase-seq ENCSR951BNY [biosample_summary="Homo sapiens H1"]
|
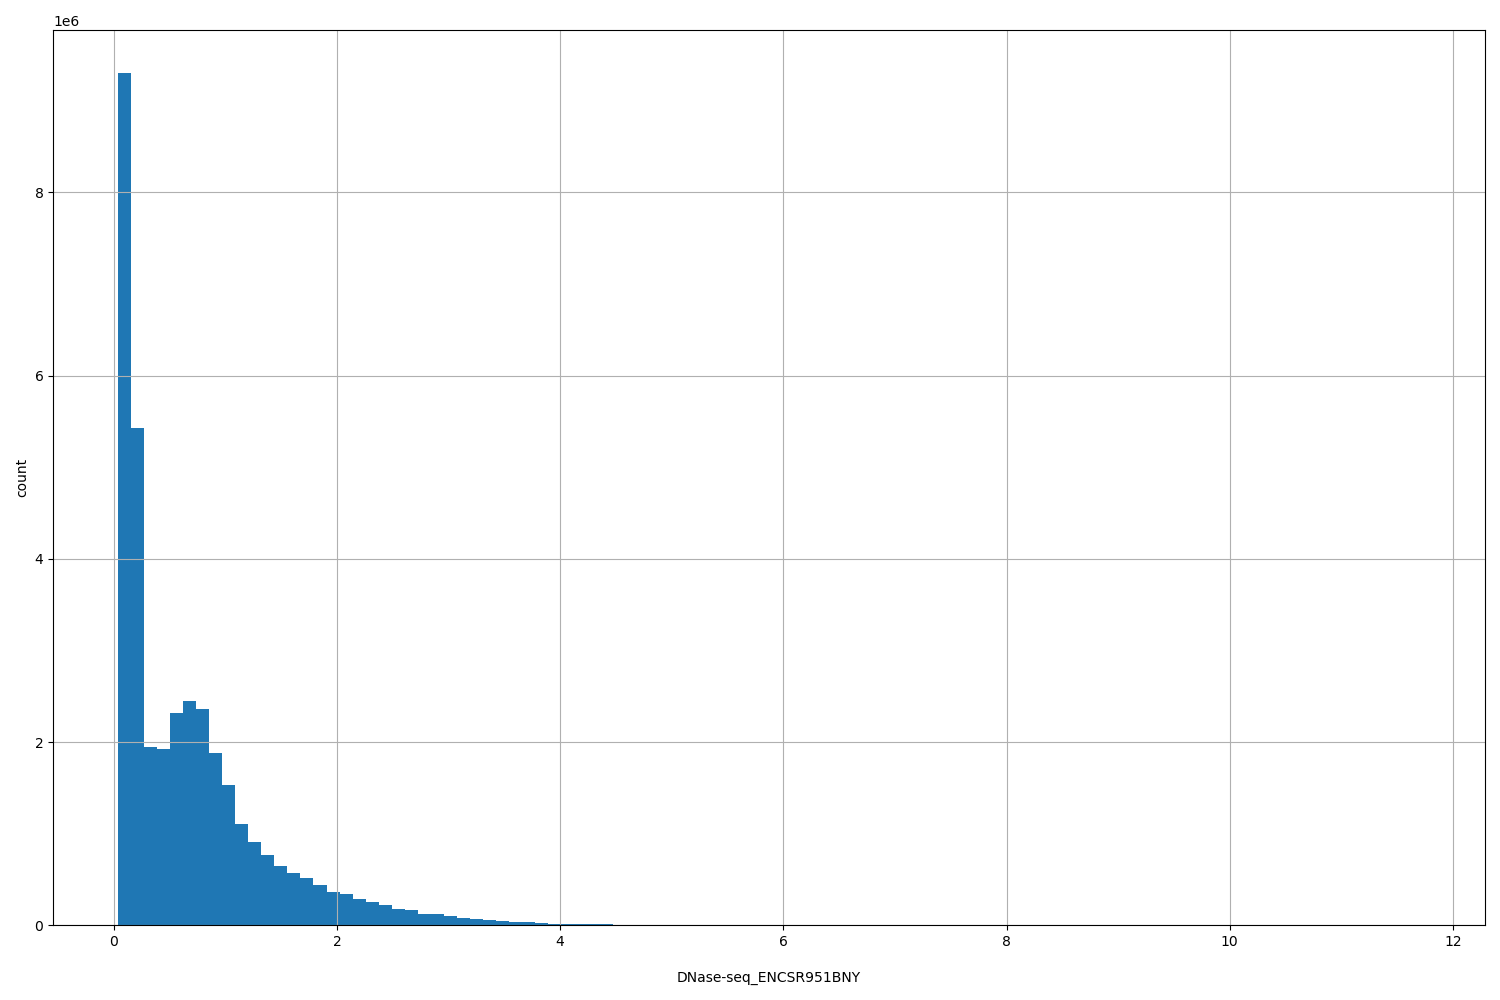 |
[0.0395, 11.7] |
|
n counts base pairs; sd is the population standard deviation.
Coverage
| Chromosome | Covered positions | Covered % | Segments |
|---|---|---|---|
| all chromosomes | 36774617 | 1.14% | 151541 |
| chr1 | 3369808 | 1.35% | 13368 |
| chr2 | 3150110 | 1.30% | 13105 |
| chr3 | 2107082 | 1.06% | 8782 |
| chr4 | 1362086 | 0.72% | 5583 |
| chr5 | 1725166 | 0.95% | 7132 |
| chr6 | 1918262 | 1.12% | 7951 |
| chr7 | 2018398 | 1.27% | 8439 |
| chr8 | 1515962 | 1.04% | 6352 |
| chr9 | 1573399 | 1.14% | 6532 |
| chr10 | 2084724 | 1.56% | 8575 |
| chr11 | 2008333 | 1.49% | 8161 |
| chr12 | 1588587 | 1.19% | 6594 |
| chr13 | 882339 | 0.77% | 3642 |
| chr14 | 1266001 | 1.18% | 5183 |
| chr15 | 1477737 | 1.45% | 6128 |
| chr16 | 1278003 | 1.41% | 5322 |
| chr17 | 1789919 | 2.15% | 7355 |
| chr18 | 762391 | 0.95% | 3277 |
| chr19 | 1574972 | 2.69% | 6401 |
| chr20 | 1166372 | 1.81% | 4752 |
| chr21 | 449600 | 0.96% | 1839 |
| chr22 | 918164 | 1.81% | 3781 |
| chrX | 764444 | 0.49% | 3184 |
| chrY | 22758 | 0.04% | 103 |
| 3342 contigs with no values (129077085 bp) | 0 | 0.00% | 0 |
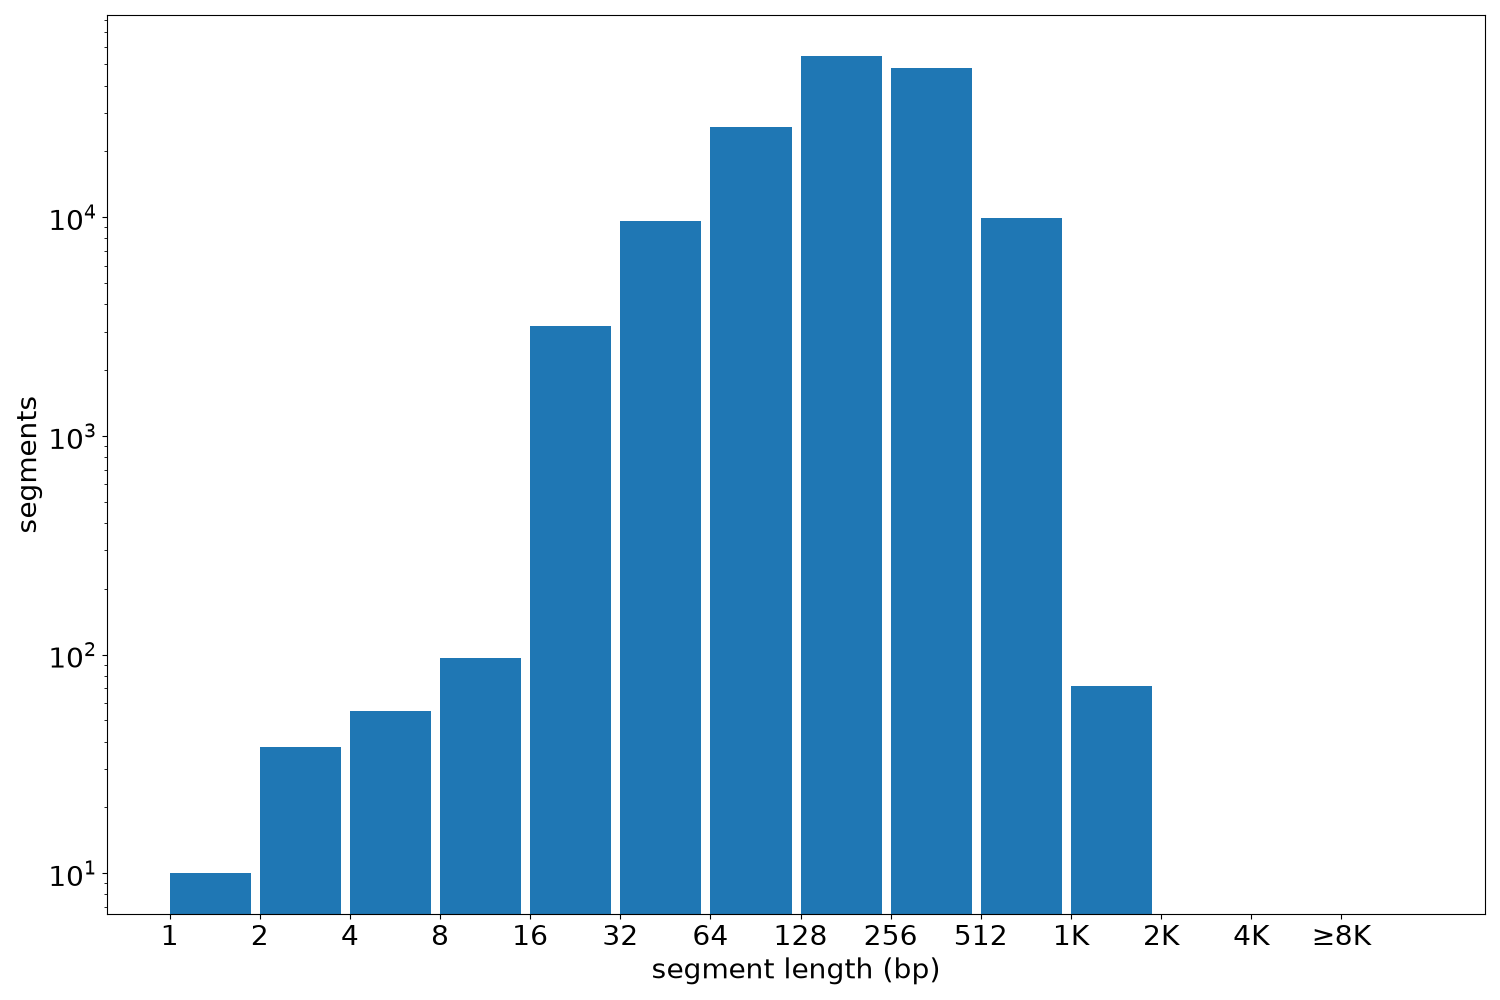
Segment lengths
| segments | min | max | mean | median | |
|---|---|---|---|---|---|
| segments | 151541 | 1 | 1540 | 242.67 | 213 |
Files
| Filename | Size | md5 |
|---|---|---|
| ENCFF643ZJV.bed.gz | 1.48 MB | 4db5d98f1005965fef6ac44c11049639 |
| ENCFF643ZJV.tabix.bed.gz | 1.42 MB | 6fea1eb8c1836d9c40a1cdb093315764 |
| ENCFF643ZJV.tabix.bed.gz.tbi | 361.96 KB | 1f81a8d73243fb5ce9e1ccb1cc2a3afc |
| genomic_resource.yaml | 2.74 KB | bf55433dae888d7bb4588cbe49410e16 |
| statistics/ |