Resource
| Id | DNase-seq/ENCSR945KSP |
|---|---|
| Type | position_score |
| Version | 0 |
| Summary | DNase-seq ENCSR945KSP [biosample_summary="Homo sapiens mesothelial cell of epicardium"] |
| Description |
status: released biological_replicates: Rep 1 summary: female embryo (5 days) output_type: peaks audit_warning: Signal Portion of Tags (SPOT) is a measure of enrichment, analogous to the commonly used fraction of reads in peaks metric. ENCODE processed alignment files {ENCFF437GFL|/files/ENCFF437GFL/} processed by DNase-seq ENCODE4 v3.0.0 GRCh38 pipeline ({ENCPL848KLD|/pipelines/ENCPL848KLD/}) for GRCh38 assembly have a SPOT1 score of 0.34. According to ENCODE standards, SPOT1 score of 0.4 or higher is considered a product of high quality data. Any sample with a SPOT1 score <0.3 should be targeted for replacement with a higher quality sample, and a SPOT1 score of 0.25 is considered minimally acceptable SPOT1 score of 0.25 is considered minimally acceptable for rare and hard to find primary tissues. (See {ENCODE DNase-seq data standards|/data-standards/dnase-seq-encode4/}) |
| Labels |
|
Scores (1)
| ID | Type | Default annotation | Description | Histogram | Range | Summary |
|---|---|---|---|---|---|---|
| DNase-seq_ENCSR945KSP | float |
DNase-seq_ENCSR945KSP |
DNase-seq ENCSR945KSP [biosample_summary="Homo sapiens mesothelial cell of epicardium"]
|
 |
[0.107, 15] |
|
n counts base pairs; sd is the population standard deviation.
Coverage
| Chromosome | Covered positions | Covered % | Segments |
|---|---|---|---|
| all chromosomes | 7773933 | 0.24% | 40682 |
| chr1 | 762789 | 0.31% | 3978 |
| chr2 | 568321 | 0.23% | 3014 |
| chr3 | 416510 | 0.21% | 2153 |
| chr4 | 348027 | 0.18% | 1745 |
| chr5 | 350478 | 0.19% | 1825 |
| chr6 | 375386 | 0.22% | 1970 |
| chr7 | 384708 | 0.24% | 1983 |
| chr8 | 352077 | 0.24% | 1877 |
| chr9 | 342953 | 0.25% | 1818 |
| chr10 | 387426 | 0.29% | 2057 |
| chr11 | 441770 | 0.33% | 2328 |
| chr12 | 357069 | 0.27% | 1861 |
| chr13 | 168951 | 0.15% | 874 |
| chr14 | 274991 | 0.26% | 1432 |
| chr15 | 250906 | 0.25% | 1320 |
| chr16 | 282818 | 0.31% | 1480 |
| chr17 | 390682 | 0.47% | 2070 |
| chr18 | 141367 | 0.18% | 741 |
| chr19 | 427021 | 0.73% | 2185 |
| chr20 | 230675 | 0.36% | 1250 |
| chr21 | 115615 | 0.25% | 602 |
| chr22 | 214546 | 0.42% | 1144 |
| chrX | 188345 | 0.12% | 971 |
| chrY | 502 | <0.01% | 4 |
| 3342 contigs with no values (129077085 bp) | 0 | 0.00% | 0 |
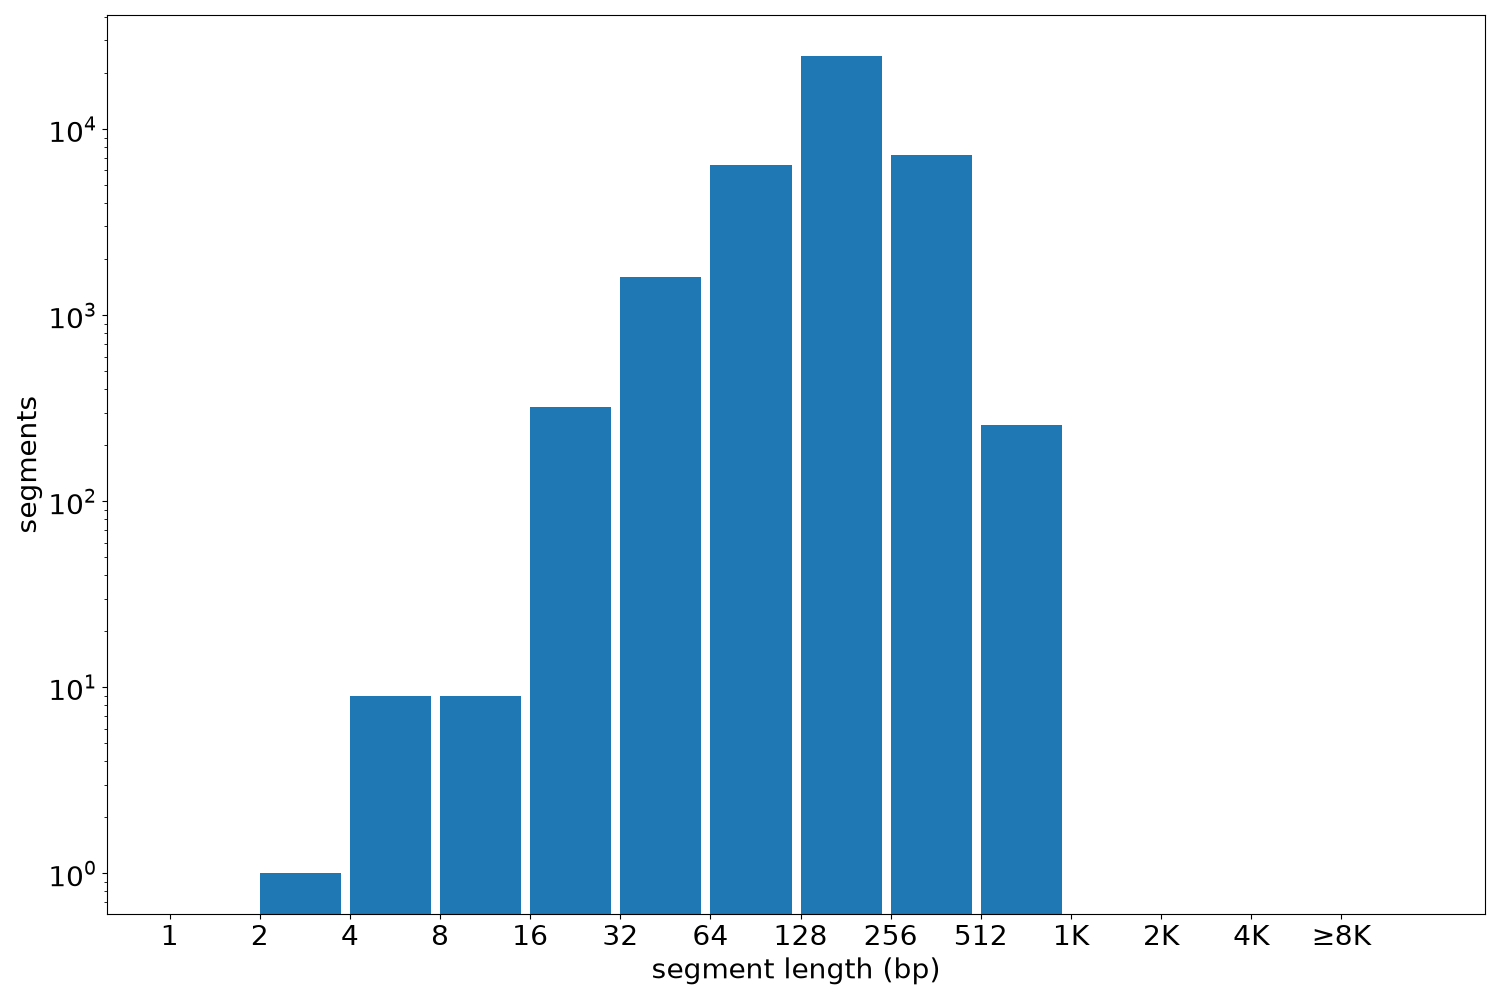
Segment lengths
| segments | min | max | mean | median | |
|---|---|---|---|---|---|
| segments | 40682 | 3 | 1020 | 191.09 | 180 |
Files
| Filename | Size | md5 |
|---|---|---|
| ENCFF994UOU.bed.gz | 438.63 KB | 4476b2cdb10575967d9c73643e2a2325 |
| ENCFF994UOU.tabix.bed.gz | 402.24 KB | e20fac32ba99aeba6be0ed6d35ddf557 |
| ENCFF994UOU.tabix.bed.gz.tbi | 186.05 KB | 674f07bc597dd12eb902cd6c2183dced |
| genomic_resource.yaml | 2.01 KB | 9794e27740d287b63ae929fa9292396d |
| statistics/ |