Resource
| Id | DNase-seq/ENCSR940CXU |
|---|---|
| Type | position_score |
| Version | 0 |
| Summary | DNase-seq ENCSR940CXU [biosample_summary="Homo sapiens endodermal cell originated from H1"] |
| Description |
status: released biological_replicates: Rep 1 summary: male embryo output_type: peaks audit_warning: Signal Portion of Tags (SPOT) is a measure of enrichment, analogous to the commonly used fraction of reads in peaks metric. ENCODE processed alignment files {ENCFF953MMX|/files/ENCFF953MMX/} processed by DNase-seq ENCODE4 v3.0.0 GRCh38 pipeline ({ENCPL848KLD|/pipelines/ENCPL848KLD/}) for GRCh38 assembly have a SPOT1 score of 0.35. According to ENCODE standards, SPOT1 score of 0.4 or higher is considered a product of high quality data. Any sample with a SPOT1 score <0.3 should be targeted for replacement with a higher quality sample, and a SPOT1 score of 0.25 is considered minimally acceptable SPOT1 score of 0.25 is considered minimally acceptable for rare and hard to find primary tissues. (See {ENCODE DNase-seq data standards|/data-standards/dnase-seq-encode4/}) |
| Labels |
|
Scores (1)
| ID | Type | Default annotation | Description | Histogram | Range | Summary |
|---|---|---|---|---|---|---|
| DNase-seq_ENCSR940CXU | float |
DNase-seq_ENCSR940CXU |
DNase-seq ENCSR940CXU [biosample_summary="Homo sapiens endodermal cell originated from H1"]
|
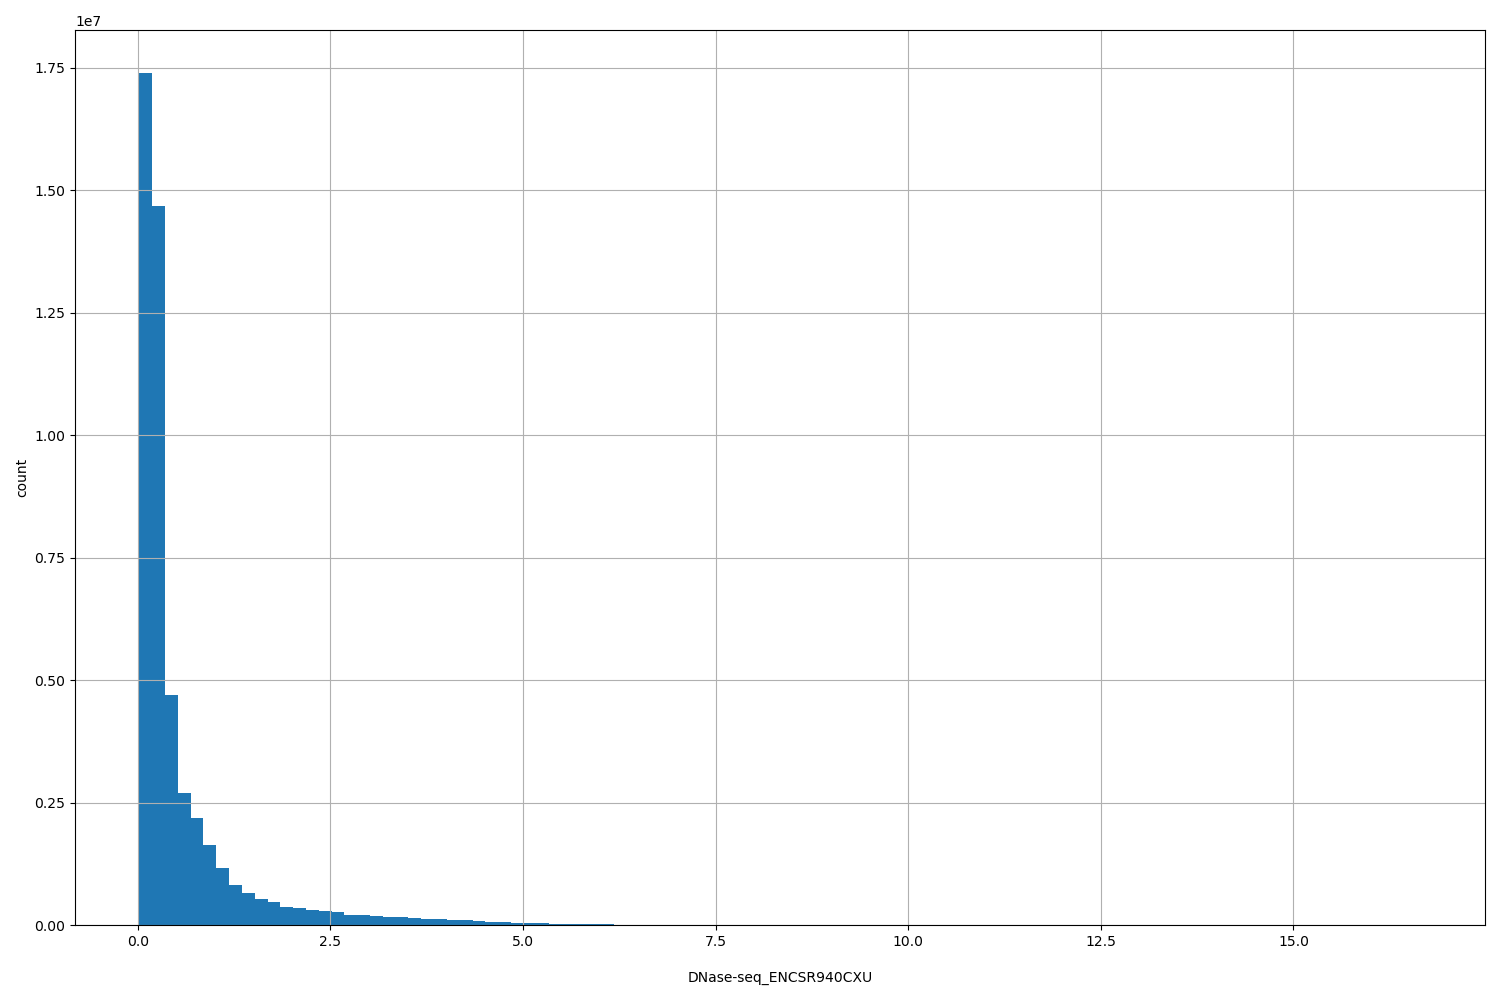 |
[0.0207, 16.7] |
|
n counts base pairs; sd is the population standard deviation.
Coverage
| Chromosome | Covered positions | Covered % | Segments |
|---|---|---|---|
| all chromosomes | 50810956 | 1.58% | 248539 |
| chr1 | 4930817 | 1.98% | 23655 |
| chr2 | 4500096 | 1.86% | 21858 |
| chr3 | 2640923 | 1.33% | 13130 |
| chr4 | 1566683 | 0.82% | 7710 |
| chr5 | 2500609 | 1.38% | 12295 |
| chr6 | 2163649 | 1.27% | 10873 |
| chr7 | 2608104 | 1.64% | 12729 |
| chr8 | 2365643 | 1.63% | 11571 |
| chr9 | 2282024 | 1.65% | 11113 |
| chr10 | 3206583 | 2.40% | 15559 |
| chr11 | 3008236 | 2.23% | 14461 |
| chr12 | 1904133 | 1.43% | 9541 |
| chr13 | 1119330 | 0.98% | 5548 |
| chr14 | 1721655 | 1.61% | 8369 |
| chr15 | 2008312 | 1.97% | 9858 |
| chr16 | 1953791 | 2.16% | 9674 |
| chr17 | 2675562 | 3.21% | 13029 |
| chr18 | 1041043 | 1.30% | 5288 |
| chr19 | 1695828 | 2.89% | 8418 |
| chr20 | 1682452 | 2.61% | 8281 |
| chr21 | 926124 | 1.98% | 4413 |
| chr22 | 1590384 | 3.13% | 7454 |
| chrX | 699163 | 0.45% | 3596 |
| chrY | 19812 | 0.03% | 116 |
| 3342 contigs with no values (129077085 bp) | 0 | 0.00% | 0 |
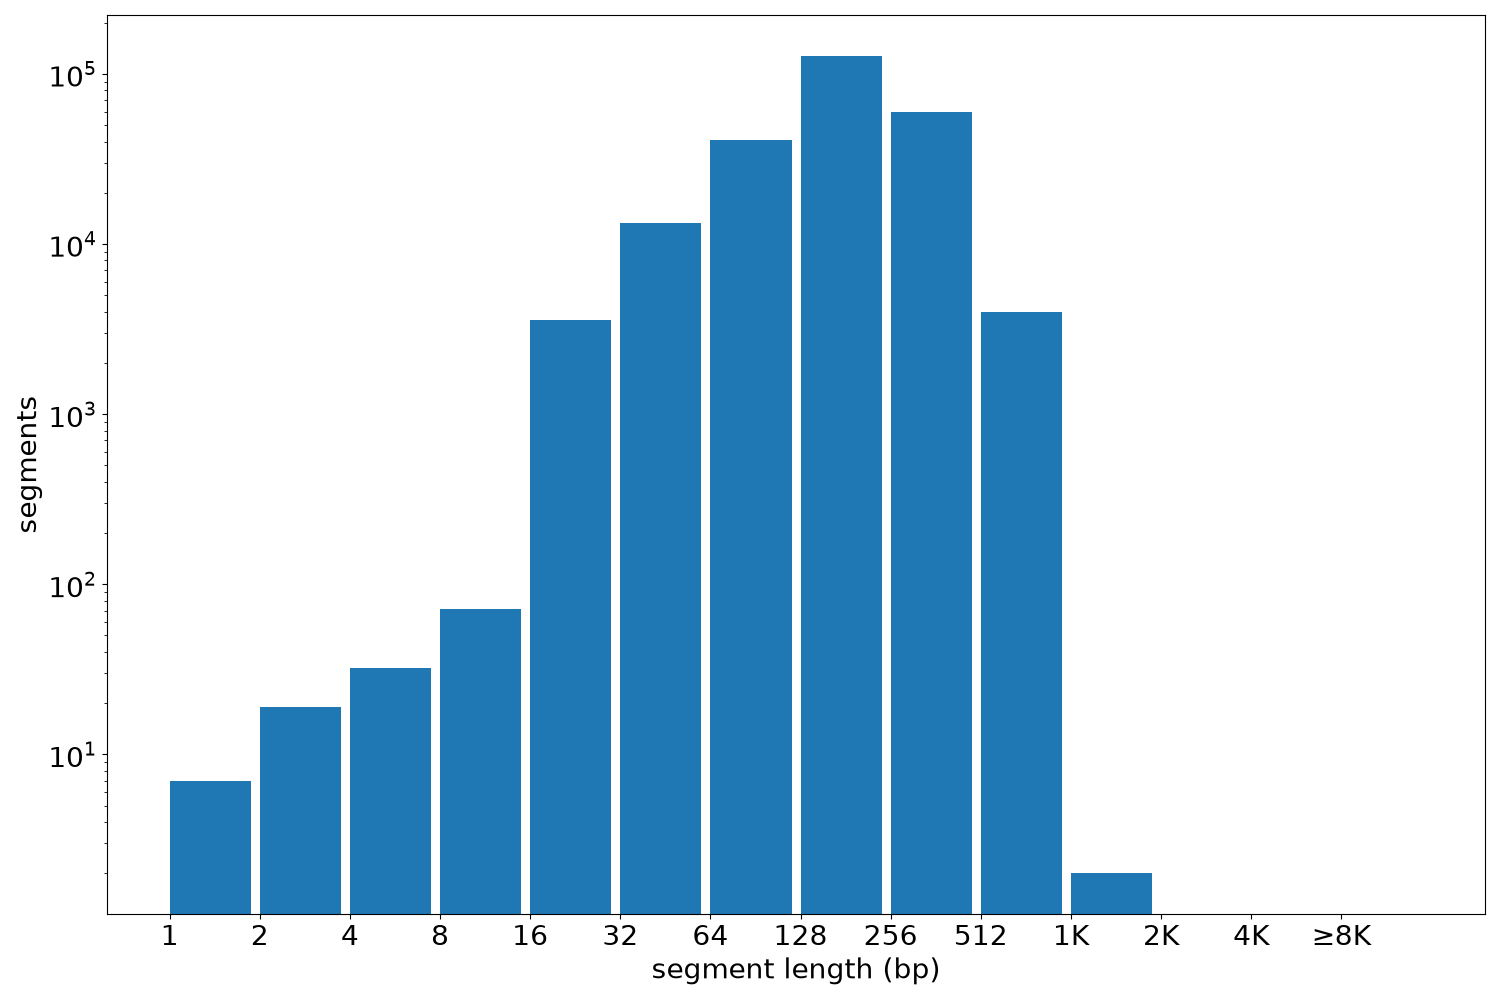
Segment lengths
| segments | min | max | mean | median | |
|---|---|---|---|---|---|
| segments | 248539 | 1 | 1040 | 204.44 | 188 |
Files
| Filename | Size | md5 |
|---|---|---|
| ENCFF999SYR.bed.gz | 2.43 MB | 5fc7d4ecd46a4df5ab6c4eaf8dd6cc75 |
| ENCFF999SYR.tabix.bed.gz | 2.3 MB | 638bef8e43b19a9c3510f63dd303ee1a |
| ENCFF999SYR.tabix.bed.gz.tbi | 385.27 KB | f5b334dad27392332bc260633958d31e |
| genomic_resource.yaml | 2.0 KB | 1de4adfb31cfa0616f66a5d073fac363 |
| statistics/ |