Resource
| Id | DNase-seq/ENCSR932KWJ |
|---|---|
| Type | position_score |
| Version | 0 |
| Summary | DNase-seq ENCSR932KWJ [biosample_summary="Homo sapiens A172"] |
| Description |
status: released biological_replicates: Rep 2 summary: output_type: peaks audit_warning: Signal Portion of Tags (SPOT) is a measure of enrichment, analogous to the commonly used fraction of reads in peaks metric. ENCODE processed alignment files {ENCFF567HRE|/files/ENCFF567HRE/} processed by DNase-seq ENCODE4 v3.0.0-alpha.2 GRCh38 pipeline ({ENCPL848KLD|/pipelines/ENCPL848KLD/}) for GRCh38 assembly have a SPOT1 score of 0.33. According to ENCODE standards, SPOT1 score of 0.4 or higher is considered a product of high quality data. Any sample with a SPOT1 score <0.3 should be targeted for replacement with a higher quality sample, and a SPOT1 score of 0.25 is considered minimally acceptable SPOT1 score of 0.25 is considered minimally acceptable for rare and hard to find primary tissues. (See {ENCODE DNase-seq data standards|/data-standards/dnase-seq-encode4/}) |
| Labels |
|
Scores (1)
| ID | Type | Default annotation | Description | Histogram | Range | Summary |
|---|---|---|---|---|---|---|
| DNase-seq_ENCSR932KWJ | float |
DNase-seq_ENCSR932KWJ |
DNase-seq ENCSR932KWJ [biosample_summary="Homo sapiens A172"]
|
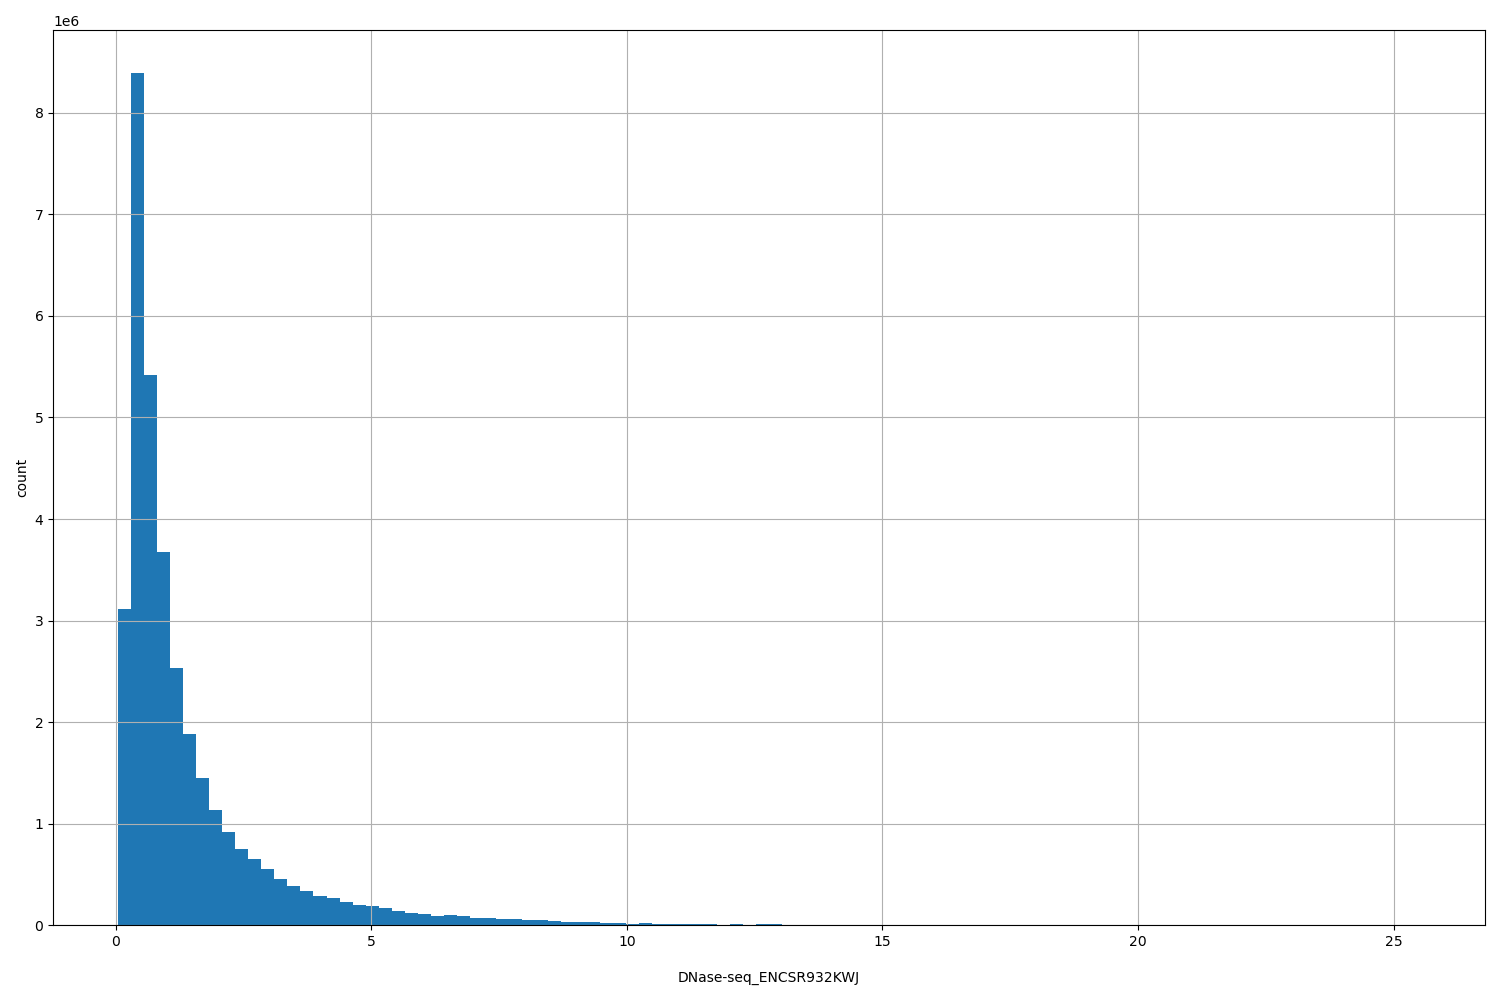 |
[0.0503, 25.5] |
|
n counts base pairs; sd is the population standard deviation.
Coverage
| Chromosome | Covered positions | Covered % | Segments |
|---|---|---|---|
| all chromosomes | 34493991 | 1.07% | 171969 |
| chr1 | 3147349 | 1.26% | 15533 |
| chr2 | 2994131 | 1.24% | 14946 |
| chr3 | 2366366 | 1.19% | 11689 |
| chr4 | 1814026 | 0.95% | 9213 |
| chr5 | 2116220 | 1.17% | 10526 |
| chr6 | 2039211 | 1.19% | 10155 |
| chr7 | 1954296 | 1.23% | 9778 |
| chr8 | 1521645 | 1.05% | 7642 |
| chr9 | 1483063 | 1.07% | 7381 |
| chr10 | 1739985 | 1.30% | 8644 |
| chr11 | 1618371 | 1.20% | 8051 |
| chr12 | 1620695 | 1.22% | 8109 |
| chr13 | 910891 | 0.80% | 4628 |
| chr14 | 881467 | 0.82% | 4464 |
| chr15 | 1012465 | 0.99% | 5074 |
| chr16 | 1070661 | 1.19% | 5318 |
| chr17 | 1509094 | 1.81% | 7368 |
| chr18 | 728142 | 0.91% | 3708 |
| chr19 | 1093470 | 1.87% | 5352 |
| chr20 | 920629 | 1.43% | 4581 |
| chr21 | 432405 | 0.93% | 2107 |
| chr22 | 512259 | 1.01% | 2560 |
| chrX | 944082 | 0.61% | 4830 |
| chrY | 63068 | 0.11% | 312 |
| 3342 contigs with no values (129077085 bp) | 0 | 0.00% | 0 |
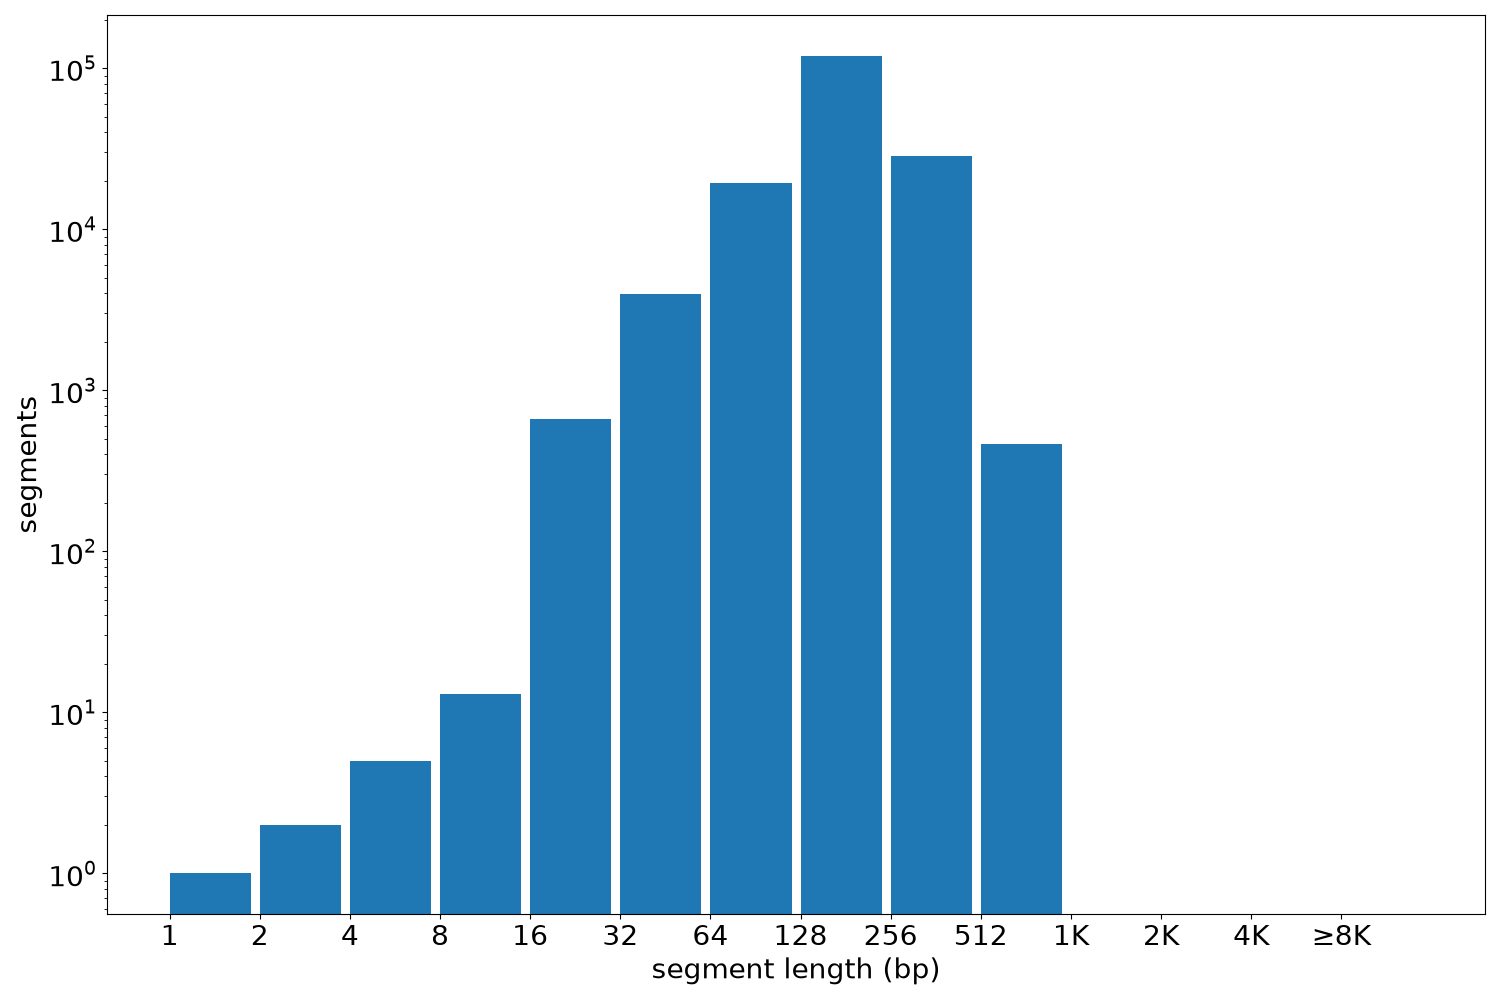
Segment lengths
| segments | min | max | mean | median | |
|---|---|---|---|---|---|
| segments | 171969 | 1 | 880 | 200.58 | 200 |
Files
| Filename | Size | md5 |
|---|---|---|
| ENCFF693MBQ.bed.gz | 1.83 MB | 202b58f17eb77c73eeddbb6c7b08d6c3 |
| ENCFF693MBQ.tabix.bed.gz | 1.67 MB | ede1c47e49fe91d57ca9c781c584abb0 |
| ENCFF693MBQ.tabix.bed.gz.tbi | 607.37 KB | acc259c98d4f770a7c43a602be4a4582 |
| genomic_resource.yaml | 1.91 KB | 1b76f7cf3d9b929cba63b803de4a9d33 |
| statistics/ |