Resource
| Id | DNase-seq/ENCSR930YSB |
|---|---|
| Type | position_score |
| Version | 0 |
| Summary | DNase-seq ENCSR930YSB [biosample_summary="Homo sapiens stomach tissue female embryo (96 days)"] |
| Description |
status: released biological_replicates: Rep 1 summary: female embryo (96 days) output_type: peaks audit_internal_action: Archived analysis {ENCAN587MNH|/analyses/ENCAN587MNH/} has in progress subobject quality standard {encode3-dnase|/quality-standards/encode3-dnase/} audit_warning: Signal Portion of Tags (SPOT) is a measure of enrichment, analogous to the commonly used fraction of reads in peaks metric. ENCODE processed alignment files {ENCFF594MMQ|/files/ENCFF594MMQ/} processed by DNase-seq ENCODE3 GRCh38 pipeline ({ENCPL001DNS|/pipelines/ENCPL001DNS/}) for GRCh38 assembly have a SPOT1 score of 0.33. According to ENCODE standards, SPOT1 score of 0.4 or higher is considered a product of high quality data. Any sample with a SPOT1 score <0.3 should be targeted for replacement with a higher quality sample, and a SPOT1 score of 0.25 is considered minimally acceptable SPOT1 score of 0.25 is considered minimally acceptable for rare and hard to find primary tissues. (See {ENCODE DNase-seq data standards|/data-standards/dnase-seq/}) |
| Labels |
|
Scores (1)
| ID | Type | Default annotation | Description | Histogram | Range | Summary |
|---|---|---|---|---|---|---|
| DNase-seq_ENCSR930YSB | float |
DNase-seq_ENCSR930YSB |
DNase-seq ENCSR930YSB [biosample_summary="Homo sapiens stomach tissue female embryo (96 days)"]
|
 |
[4, 1.86e+03] |
|
n counts base pairs; sd is the population standard deviation.
Coverage
| Chromosome | Covered positions | Covered % | Segments |
|---|---|---|---|
| all chromosomes | 16638821 | 0.52% | 110434 |
| chr1 | 1541639 | 0.62% | 10234 |
| chr2 | 1310696 | 0.54% | 8689 |
| chr3 | 1061004 | 0.54% | 7042 |
| chr4 | 863647 | 0.45% | 5731 |
| chr5 | 904962 | 0.50% | 6005 |
| chr6 | 1020190 | 0.60% | 6765 |
| chr7 | 843012 | 0.53% | 5592 |
| chr8 | 758506 | 0.52% | 5037 |
| chr9 | 677275 | 0.49% | 4492 |
| chr10 | 797107 | 0.60% | 5285 |
| chr11 | 841365 | 0.62% | 5590 |
| chr12 | 839878 | 0.63% | 5577 |
| chr13 | 466837 | 0.41% | 3092 |
| chr14 | 540900 | 0.51% | 3591 |
| chr15 | 537953 | 0.53% | 3573 |
| chr16 | 536966 | 0.59% | 3567 |
| chr17 | 725952 | 0.87% | 4826 |
| chr18 | 374387 | 0.47% | 2477 |
| chr19 | 611542 | 1.04% | 4071 |
| chr20 | 425755 | 0.66% | 2827 |
| chr21 | 189967 | 0.41% | 1261 |
| chr22 | 281317 | 0.55% | 1873 |
| chrX | 486014 | 0.31% | 3224 |
| chrY | 1950 | <0.01% | 13 |
| 3342 contigs with no values (129077085 bp) | 0 | 0.00% | 0 |
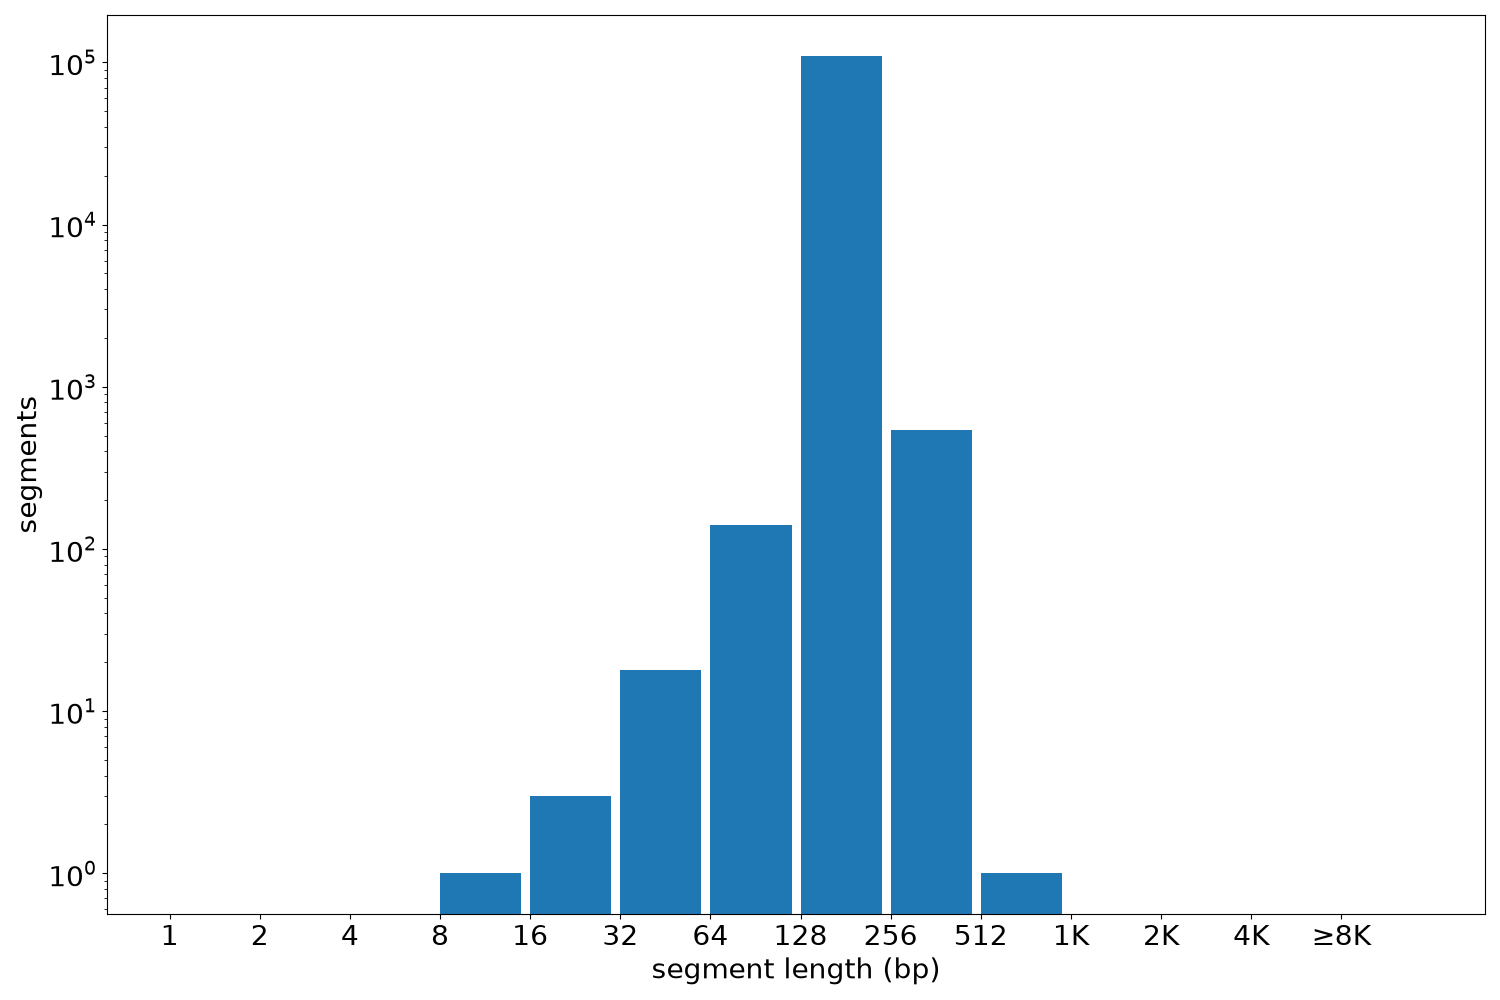
Segment lengths
| segments | min | max | mean | median | |
|---|---|---|---|---|---|
| segments | 110434 | 11 | 527 | 150.67 | 150 |
Files
| Filename | Size | md5 |
|---|---|---|
| ENCFF749DUT.bed.gz | 1.04 MB | 50b0226b95659efb8279834987cc1565 |
| ENCFF749DUT.tabix.bed.gz | 913.52 KB | d0f334cf7cb1fcd3784b51bfd68b7c03 |
| ENCFF749DUT.tabix.bed.gz.tbi | 464.71 KB | 2fe252bfc9f5f0dafb265f6e42ab7c2a |
| genomic_resource.yaml | 2.19 KB | 83c95d28d4bf1dd854d66bfcc6b26423 |
| statistics/ |