Resource
| Id | DNase-seq/ENCSR917BSW |
|---|---|
| Type | position_score |
| Version | 0 |
| Summary | DNase-seq ENCSR917BSW [biosample_summary="Homo sapiens stimulated activated effector memory CD8-positive, alpha-beta T cell male adult (36 years) treated with 100 ng/mL Interleukin-12 subunit alpha for 72 hours, anti-CD3 and anti-CD28 coated beads for 72 hours, 100 ng/mL Interleukin-12 subunit beta for 72 hours"] |
| Description |
status: released biological_replicates: Rep 1 summary: male adult (36 years) treated with 100 ng/mL Interleukin-12 subunit alpha for 72 hours, anti-CD3 and anti-CD28 coated beads for 72 hours, 100 ng/mL Interleukin-12 subunit beta for 72 hours output_type: peaks audit_warning: Signal Portion of Tags (SPOT) is a measure of enrichment, analogous to the commonly used fraction of reads in peaks metric. ENCODE processed alignment files {ENCFF438VZH|/files/ENCFF438VZH/} processed by DNase-seq ENCODE4 v3.0.0 GRCh38 pipeline ({ENCPL848KLD|/pipelines/ENCPL848KLD/}) for GRCh38 assembly have a SPOT1 score of 0.31. According to ENCODE standards, SPOT1 score of 0.4 or higher is considered a product of high quality data. Any sample with a SPOT1 score <0.3 should be targeted for replacement with a higher quality sample, and a SPOT1 score of 0.25 is considered minimally acceptable SPOT1 score of 0.25 is considered minimally acceptable for rare and hard to find primary tissues. (See {ENCODE DNase-seq data standards|/data-standards/dnase-seq-encode4/}) |
| Labels |
|
Scores (1)
| ID | Type | Default annotation | Description | Histogram | Range | Summary |
|---|---|---|---|---|---|---|
| DNase-seq_ENCSR917BSW | float |
DNase-seq_ENCSR917BSW |
DNase-seq ENCSR917BSW [biosample_summary="Homo sapiens stimulated activated effector memory CD8-positive, alpha-beta T cell male adult (36 years) treated with 100 ng/mL Interleukin-12 subunit alpha for 72 hours, anti-CD3 and anti-CD28 coated beads for 72 hours, 100 ng/mL Interleukin-12 subunit beta for 72 hours"]
|
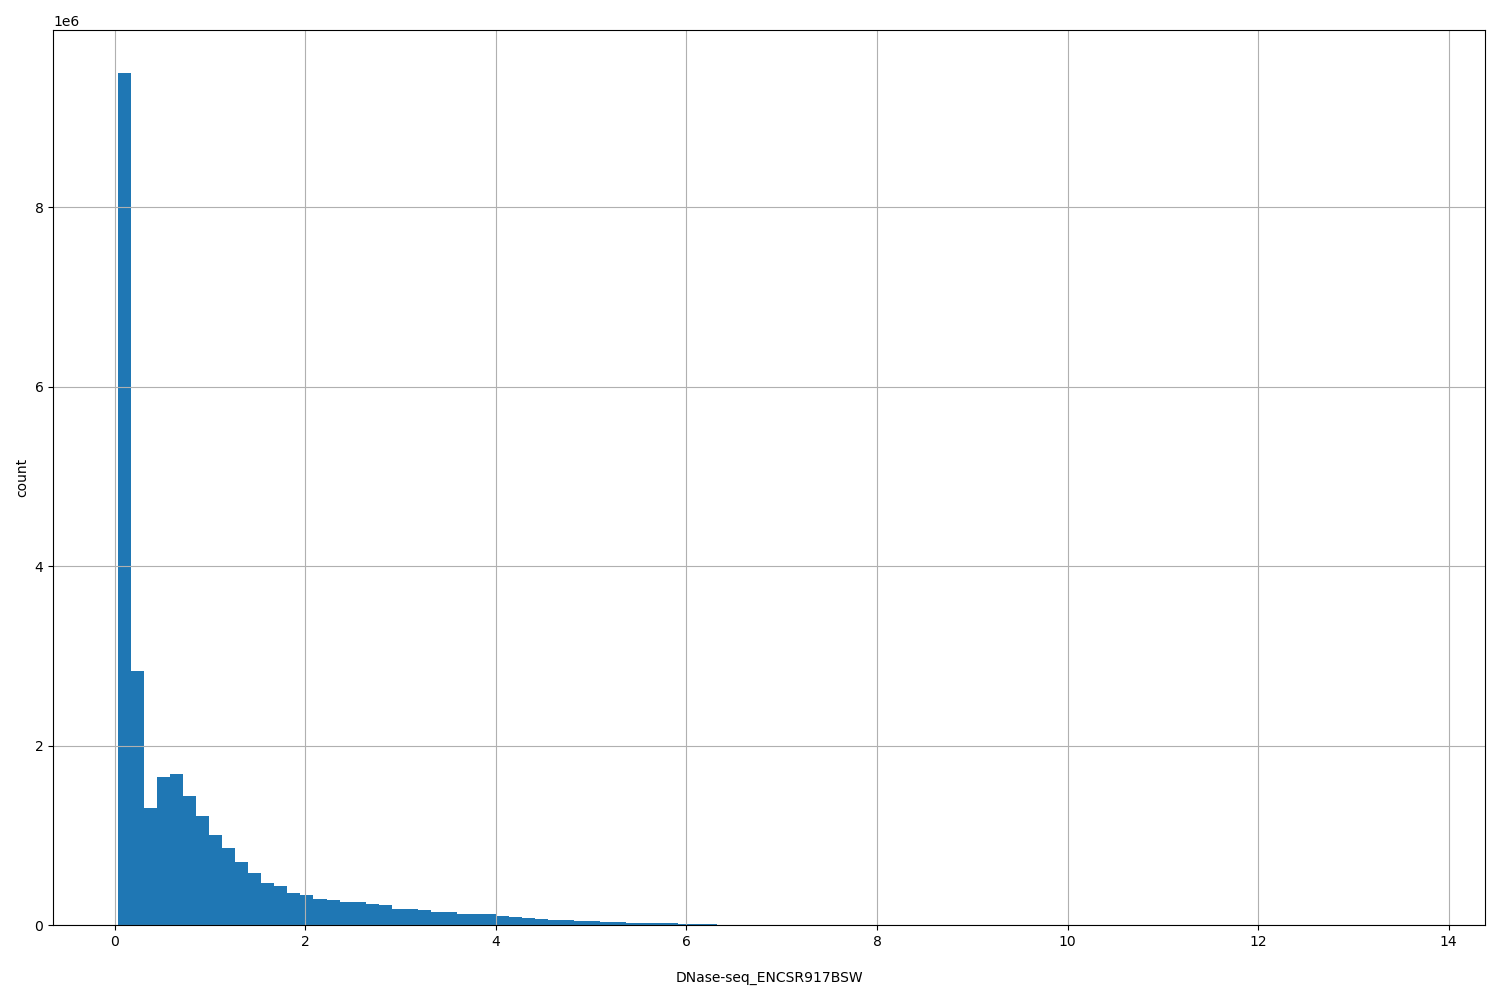 |
[0.036, 13.7] |
|
n counts base pairs; sd is the population standard deviation.
Coverage
| Chromosome | Covered positions | Covered % | Segments |
|---|---|---|---|
| all chromosomes | 28058751 | 0.87% | 120466 |
| chr1 | 2659691 | 1.07% | 11069 |
| chr2 | 2631108 | 1.09% | 11522 |
| chr3 | 1748014 | 0.88% | 7615 |
| chr4 | 844422 | 0.44% | 3668 |
| chr5 | 1349378 | 0.74% | 5849 |
| chr6 | 1775889 | 1.04% | 7610 |
| chr7 | 1313330 | 0.82% | 5768 |
| chr8 | 1081274 | 0.74% | 4753 |
| chr9 | 1141653 | 0.82% | 4959 |
| chr10 | 1607116 | 1.20% | 6985 |
| chr11 | 1366890 | 1.01% | 5932 |
| chr12 | 1239206 | 0.93% | 5212 |
| chr13 | 622738 | 0.54% | 2747 |
| chr14 | 948494 | 0.89% | 4055 |
| chr15 | 1049007 | 1.03% | 4638 |
| chr16 | 931088 | 1.03% | 3951 |
| chr17 | 1402556 | 1.68% | 5729 |
| chr18 | 563102 | 0.70% | 2581 |
| chr19 | 1231038 | 2.10% | 5007 |
| chr20 | 830561 | 1.29% | 3583 |
| chr21 | 353250 | 0.76% | 1562 |
| chr22 | 649794 | 1.28% | 2793 |
| chrX | 670919 | 0.43% | 2647 |
| chrY | 48233 | 0.08% | 231 |
| 3342 contigs with no values (129077085 bp) | 0 | 0.00% | 0 |
Segment lengths
| segments | min | max | mean | median | |
|---|---|---|---|---|---|
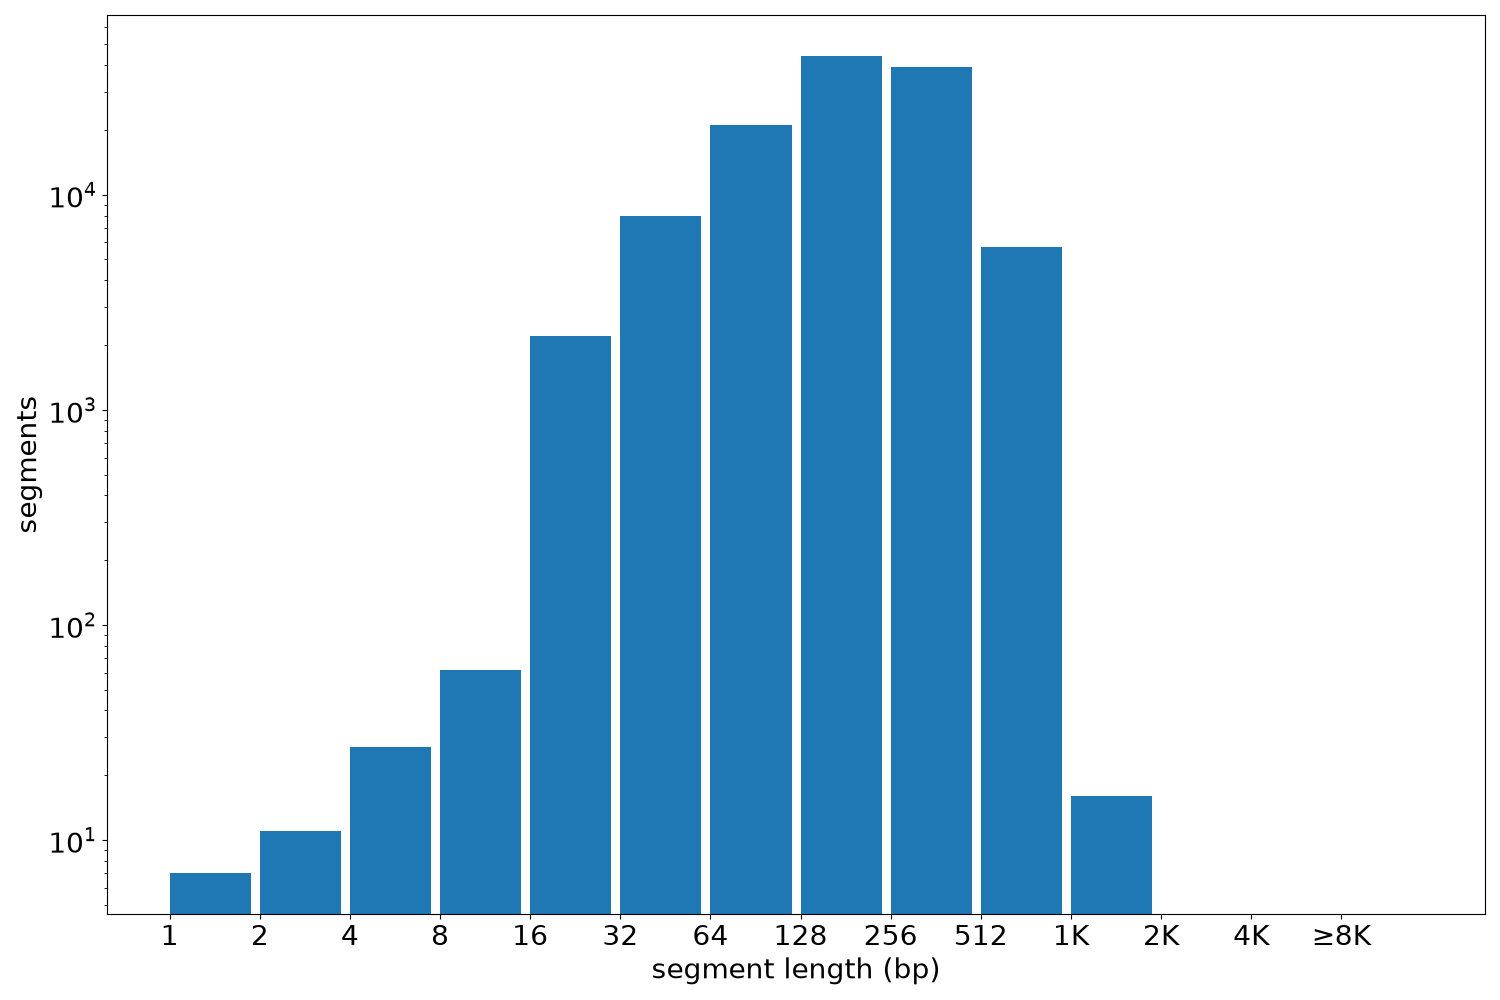
| segments | 120466 | 1 | 1600 | 232.92 | 208 |
Files
| Filename | Size | md5 |
|---|---|---|
| ENCFF449NOH.bed.gz | 1.2 MB | 6dd227675fff23ffa2a23d4c45eef6be |
| ENCFF449NOH.tabix.bed.gz | 1.14 MB | f419cad005d6d50ad68a242ab56550e7 |
| ENCFF449NOH.tabix.bed.gz.tbi | 288.47 KB | 625c9daf25ac1aa05c69339136bc2de0 |
| genomic_resource.yaml | 3.02 KB | 9e2a369c39f04a6a35dd3138189c8fe3 |
| statistics/ |