Resource
| Id | DNase-seq/ENCSR880CUB |
|---|---|
| Type | position_score |
| Version | 0 |
| Summary | DNase-seq ENCSR880CUB [biosample_summary="Homo sapiens dorsolateral prefrontal cortex tissue male adult (83 years)"] |
| Description |
status: released biological_replicates: Rep 1 summary: male adult (83 years) output_type: peaks audit_warning: Signal Portion of Tags (SPOT) is a measure of enrichment, analogous to the commonly used fraction of reads in peaks metric. ENCODE processed alignment files {ENCFF966VCS|/files/ENCFF966VCS/} processed by DNase-seq ENCODE4 v3.0.0-alpha.2 GRCh38 pipeline ({ENCPL848KLD|/pipelines/ENCPL848KLD/}) for GRCh38 assembly have a SPOT1 score of 0.28. According to ENCODE standards, SPOT1 score of 0.4 or higher is considered a product of high quality data. Any sample with a SPOT1 score <0.3 should be targeted for replacement with a higher quality sample, and a SPOT1 score of 0.25 is considered minimally acceptable SPOT1 score of 0.25 is considered minimally acceptable for rare and hard to find primary tissues. (See {ENCODE DNase-seq data standards|/data-standards/dnase-seq-encode4/}) |
| Labels |
|
Scores (1)
| ID | Type | Default annotation | Description | Histogram | Range | Summary |
|---|---|---|---|---|---|---|
| DNase-seq_ENCSR880CUB | float |
DNase-seq_ENCSR880CUB |
DNase-seq ENCSR880CUB [biosample_summary="Homo sapiens dorsolateral prefrontal cortex tissue male adult (83 years)"]
|
 |
[0.0342, 11] |
|
n counts base pairs; sd is the population standard deviation.
Coverage
| Chromosome | Covered positions | Covered % | Segments |
|---|---|---|---|
| all chromosomes | 40509497 | 1.26% | 198491 |
| chr1 | 3720810 | 1.49% | 18148 |
| chr2 | 3679007 | 1.52% | 17875 |
| chr3 | 1923582 | 0.97% | 9485 |
| chr4 | 1119802 | 0.59% | 5480 |
| chr5 | 1962934 | 1.08% | 9555 |
| chr6 | 1554600 | 0.91% | 7767 |
| chr7 | 2244345 | 1.41% | 10969 |
| chr8 | 1802391 | 1.24% | 8810 |
| chr9 | 1721292 | 1.24% | 8533 |
| chr10 | 2479149 | 1.85% | 12077 |
| chr11 | 2255326 | 1.67% | 10830 |
| chr12 | 1698071 | 1.27% | 8703 |
| chr13 | 825832 | 0.72% | 4084 |
| chr14 | 1316063 | 1.23% | 6359 |
| chr15 | 1714685 | 1.68% | 8476 |
| chr16 | 1654441 | 1.83% | 8211 |
| chr17 | 2210342 | 2.65% | 10974 |
| chr18 | 922369 | 1.15% | 4531 |
| chr19 | 1418845 | 2.42% | 6958 |
| chr20 | 1442436 | 2.24% | 7065 |
| chr21 | 676626 | 1.45% | 3269 |
| chr22 | 1607118 | 3.16% | 7518 |
| chrX | 546285 | 0.35% | 2734 |
| chrY | 13146 | 0.02% | 80 |
| 3342 contigs with no values (129077085 bp) | 0 | 0.00% | 0 |
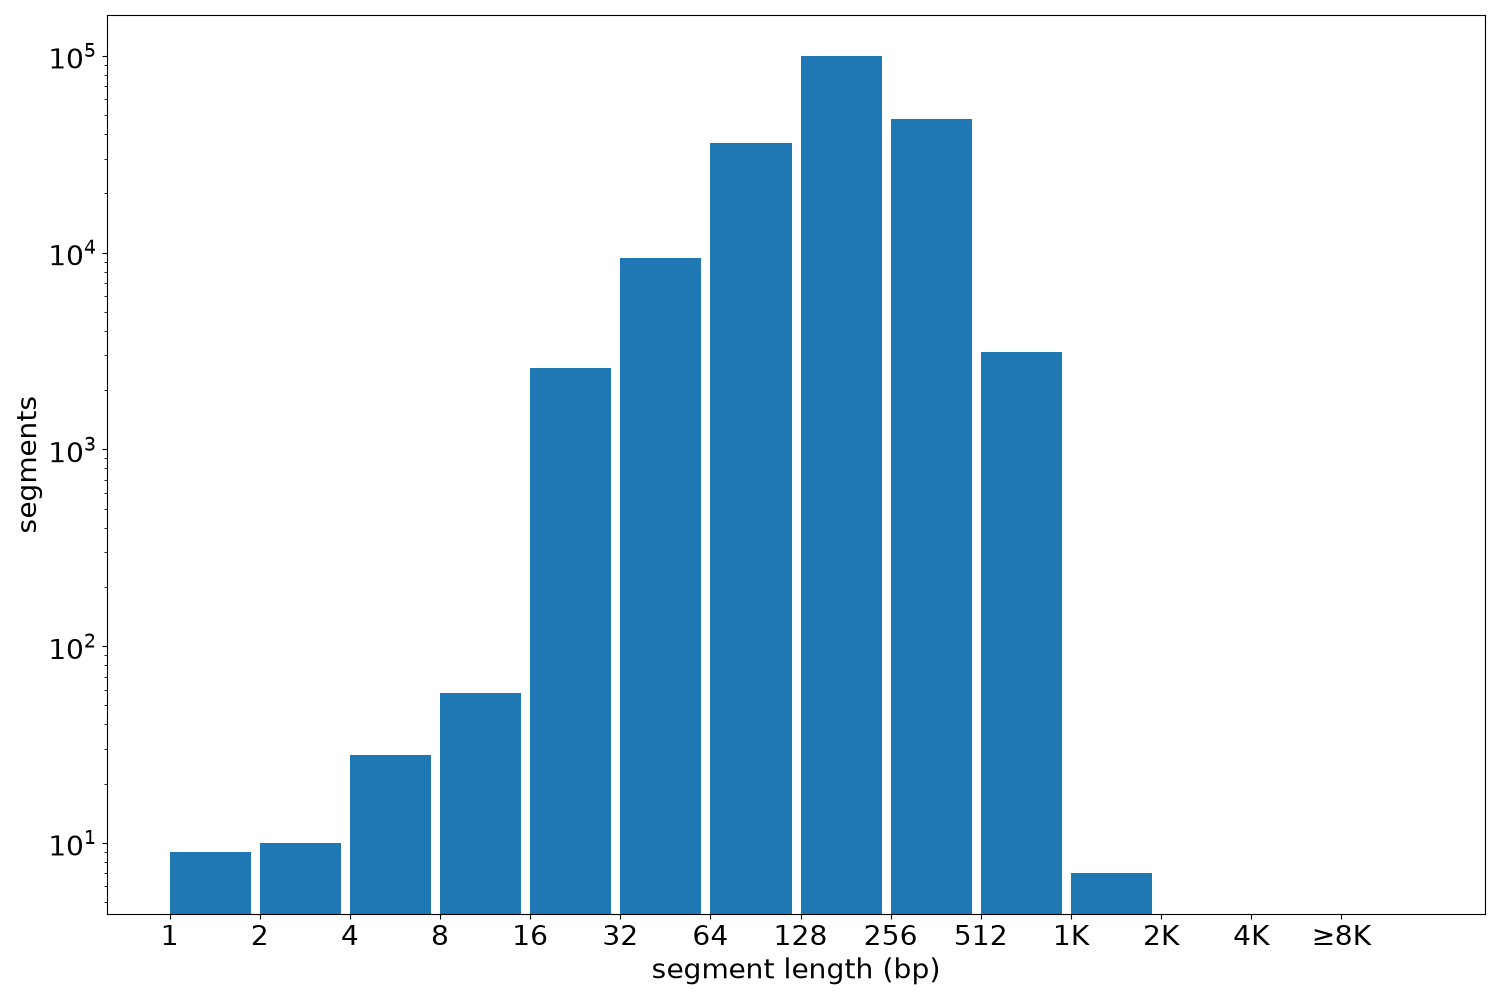
Segment lengths
| segments | min | max | mean | median | |
|---|---|---|---|---|---|
| segments | 198491 | 1 | 1300 | 204.09 | 194 |
Files
| Filename | Size | md5 |
|---|---|---|
| ENCFF750DUU.bed.gz | 1.87 MB | 14a0e152a578d8a7abf40b7195020e84 |
| ENCFF750DUU.tabix.bed.gz | 1.77 MB | fe5fa89081ba215c5dbc8a238c7733e4 |
| ENCFF750DUU.tabix.bed.gz.tbi | 291.09 KB | 6c797b090bfff8cb1d0acbf3f8df3b11 |
| genomic_resource.yaml | 2.09 KB | b4882819576f845481b2d713e1317fcb |
| statistics/ |