Resource
| Id | DNase-seq/ENCSR874CAK |
|---|---|
| Type | position_score |
| Version | 0 |
| Summary | DNase-seq ENCSR874CAK [biosample_summary="Homo sapiens large intestine tissue female embryo (108 days)"] |
| Description |
status: released biological_replicates: Rep 1 summary: female embryo (108 days) output_type: peaks audit_warning: Signal Portion of Tags (SPOT) is a measure of enrichment, analogous to the commonly used fraction of reads in peaks metric. ENCODE processed alignment files {ENCFF912GWM|/files/ENCFF912GWM/} processed by DNase-seq ENCODE4 v3.0.0-alpha.2 GRCh38 pipeline ({ENCPL848KLD|/pipelines/ENCPL848KLD/}) for GRCh38 assembly have a SPOT1 score of 0.30. According to ENCODE standards, SPOT1 score of 0.4 or higher is considered a product of high quality data. Any sample with a SPOT1 score <0.3 should be targeted for replacement with a higher quality sample, and a SPOT1 score of 0.25 is considered minimally acceptable SPOT1 score of 0.25 is considered minimally acceptable for rare and hard to find primary tissues. (See {ENCODE DNase-seq data standards|/data-standards/dnase-seq-encode4/}) |
| Labels |
|
Scores (1)
| ID | Type | Default annotation | Description | Histogram | Range | Summary |
|---|---|---|---|---|---|---|
| DNase-seq_ENCSR874CAK | float |
DNase-seq_ENCSR874CAK |
DNase-seq ENCSR874CAK [biosample_summary="Homo sapiens large intestine tissue female embryo (108 days)"]
|
 |
[0.135, 11.5] |
|
n counts base pairs; sd is the population standard deviation.
Coverage
| Chromosome | Covered positions | Covered % | Segments |
|---|---|---|---|
| all chromosomes | 14897694 | 0.46% | 74154 |
| chr1 | 1432569 | 0.58% | 7103 |
| chr2 | 1175020 | 0.49% | 5883 |
| chr3 | 945952 | 0.48% | 4712 |
| chr4 | 765950 | 0.40% | 3765 |
| chr5 | 770754 | 0.42% | 3873 |
| chr6 | 930799 | 0.54% | 4608 |
| chr7 | 755591 | 0.47% | 3836 |
| chr8 | 640185 | 0.44% | 3207 |
| chr9 | 621764 | 0.45% | 3084 |
| chr10 | 692471 | 0.52% | 3455 |
| chr11 | 757558 | 0.56% | 3804 |
| chr12 | 753613 | 0.57% | 3754 |
| chr13 | 364073 | 0.32% | 1818 |
| chr14 | 479961 | 0.45% | 2371 |
| chr15 | 466939 | 0.46% | 2378 |
| chr16 | 507494 | 0.56% | 2549 |
| chr17 | 681477 | 0.82% | 3335 |
| chr18 | 332483 | 0.41% | 1676 |
| chr19 | 629752 | 1.07% | 2913 |
| chr20 | 372307 | 0.58% | 1875 |
| chr21 | 162782 | 0.35% | 804 |
| chr22 | 277500 | 0.55% | 1432 |
| chrX | 380127 | 0.24% | 1915 |
| chrY | 573 | <0.01% | 4 |
| 3342 contigs with no values (129077085 bp) | 0 | 0.00% | 0 |
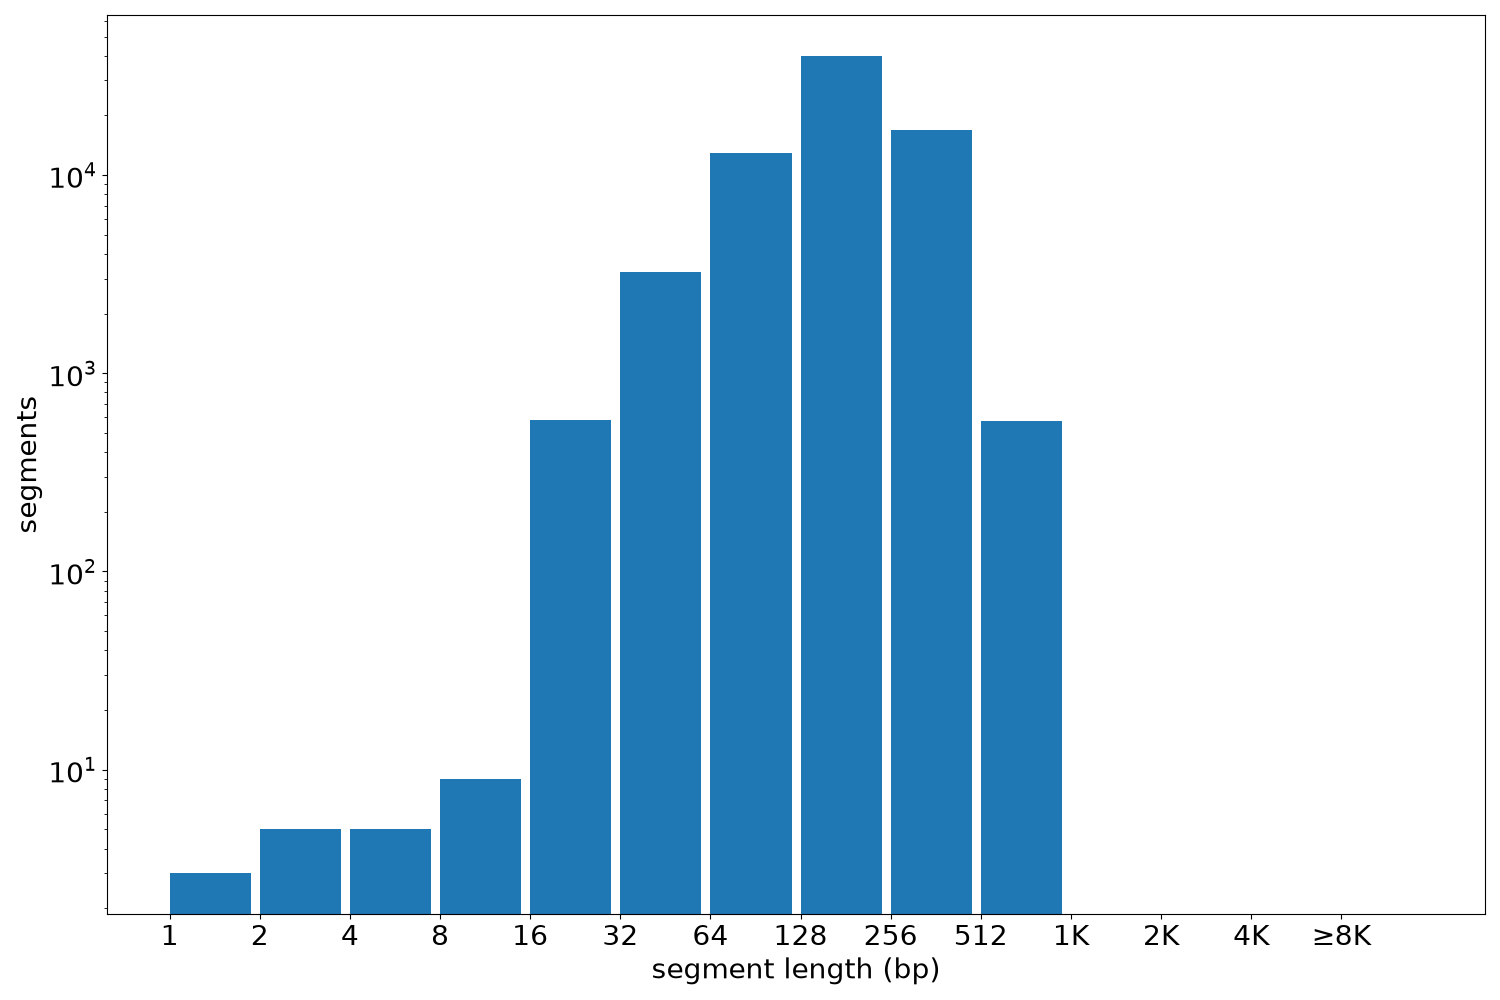
Segment lengths
| segments | min | max | mean | median | |
|---|---|---|---|---|---|
| segments | 74154 | 1 | 880 | 200.9 | 200 |
Files
| Filename | Size | md5 |
|---|---|---|
| ENCFF033GGY.bed.gz | 780.29 KB | a137219ff7156aaf283ba7c730dbdeaf |
| ENCFF033GGY.tabix.bed.gz | 708.78 KB | 6b90bf19b55a992e5b3094e47f21d34f |
| ENCFF033GGY.tabix.bed.gz.tbi | 348.67 KB | 805dc7d3cc049d1964effea2b7946b0b |
| genomic_resource.yaml | 2.06 KB | 4432eafc541b81b9f297e63487d8b65e |
| statistics/ |