Resource
| Id | DNase-seq/ENCSR829MXU |
|---|---|
| Type | position_score |
| Version | 0 |
| Summary | DNase-seq ENCSR829MXU [biosample_summary="Homo sapiens pons tissue male adult (78 years)"] |
| Description |
status: released biological_replicates: Rep 1 summary: male adult (78 years) output_type: peaks audit_warning: Signal Portion of Tags (SPOT) is a measure of enrichment, analogous to the commonly used fraction of reads in peaks metric. ENCODE processed alignment files {ENCFF070ECN|/files/ENCFF070ECN/} processed by DNase-seq ENCODE4 v3.0.0-alpha.2 GRCh38 pipeline ({ENCPL848KLD|/pipelines/ENCPL848KLD/}) for GRCh38 assembly have a SPOT1 score of 0.25. According to ENCODE standards, SPOT1 score of 0.4 or higher is considered a product of high quality data. Any sample with a SPOT1 score <0.3 should be targeted for replacement with a higher quality sample, and a SPOT1 score of 0.25 is considered minimally acceptable SPOT1 score of 0.25 is considered minimally acceptable for rare and hard to find primary tissues. (See {ENCODE DNase-seq data standards|/data-standards/dnase-seq-encode4/}) |
| Labels |
|
Scores (1)
| ID | Type | Default annotation | Description | Histogram | Range | Summary |
|---|---|---|---|---|---|---|
| DNase-seq_ENCSR829MXU | float |
DNase-seq_ENCSR829MXU |
DNase-seq ENCSR829MXU [biosample_summary="Homo sapiens pons tissue male adult (78 years)"]
|
 |
[0.0303, 18.1] |
|
n counts base pairs; sd is the population standard deviation.
Coverage
| Chromosome | Covered positions | Covered % | Segments |
|---|---|---|---|
| all chromosomes | 31058179 | 0.97% | 144176 |
| chr1 | 2861204 | 1.15% | 13130 |
| chr2 | 2537220 | 1.05% | 11787 |
| chr3 | 2090233 | 1.05% | 9628 |
| chr4 | 1588848 | 0.84% | 7372 |
| chr5 | 1780743 | 0.98% | 8201 |
| chr6 | 1913891 | 1.12% | 8691 |
| chr7 | 1576352 | 0.99% | 7463 |
| chr8 | 1375047 | 0.95% | 6434 |
| chr9 | 1352132 | 0.98% | 6293 |
| chr10 | 1495660 | 1.12% | 6938 |
| chr11 | 1580692 | 1.17% | 7336 |
| chr12 | 1478264 | 1.11% | 6835 |
| chr13 | 884795 | 0.77% | 4098 |
| chr14 | 1013942 | 0.95% | 4702 |
| chr15 | 1006642 | 0.99% | 4687 |
| chr16 | 981143 | 1.09% | 4604 |
| chr17 | 1263803 | 1.52% | 5892 |
| chr18 | 725857 | 0.90% | 3377 |
| chr19 | 952021 | 1.62% | 4402 |
| chr20 | 778228 | 1.21% | 3677 |
| chr21 | 407462 | 0.87% | 1838 |
| chr22 | 523153 | 1.03% | 2447 |
| chrX | 844557 | 0.54% | 4109 |
| chrY | 46290 | 0.08% | 235 |
| 3342 contigs with no values (129077085 bp) | 0 | 0.00% | 0 |
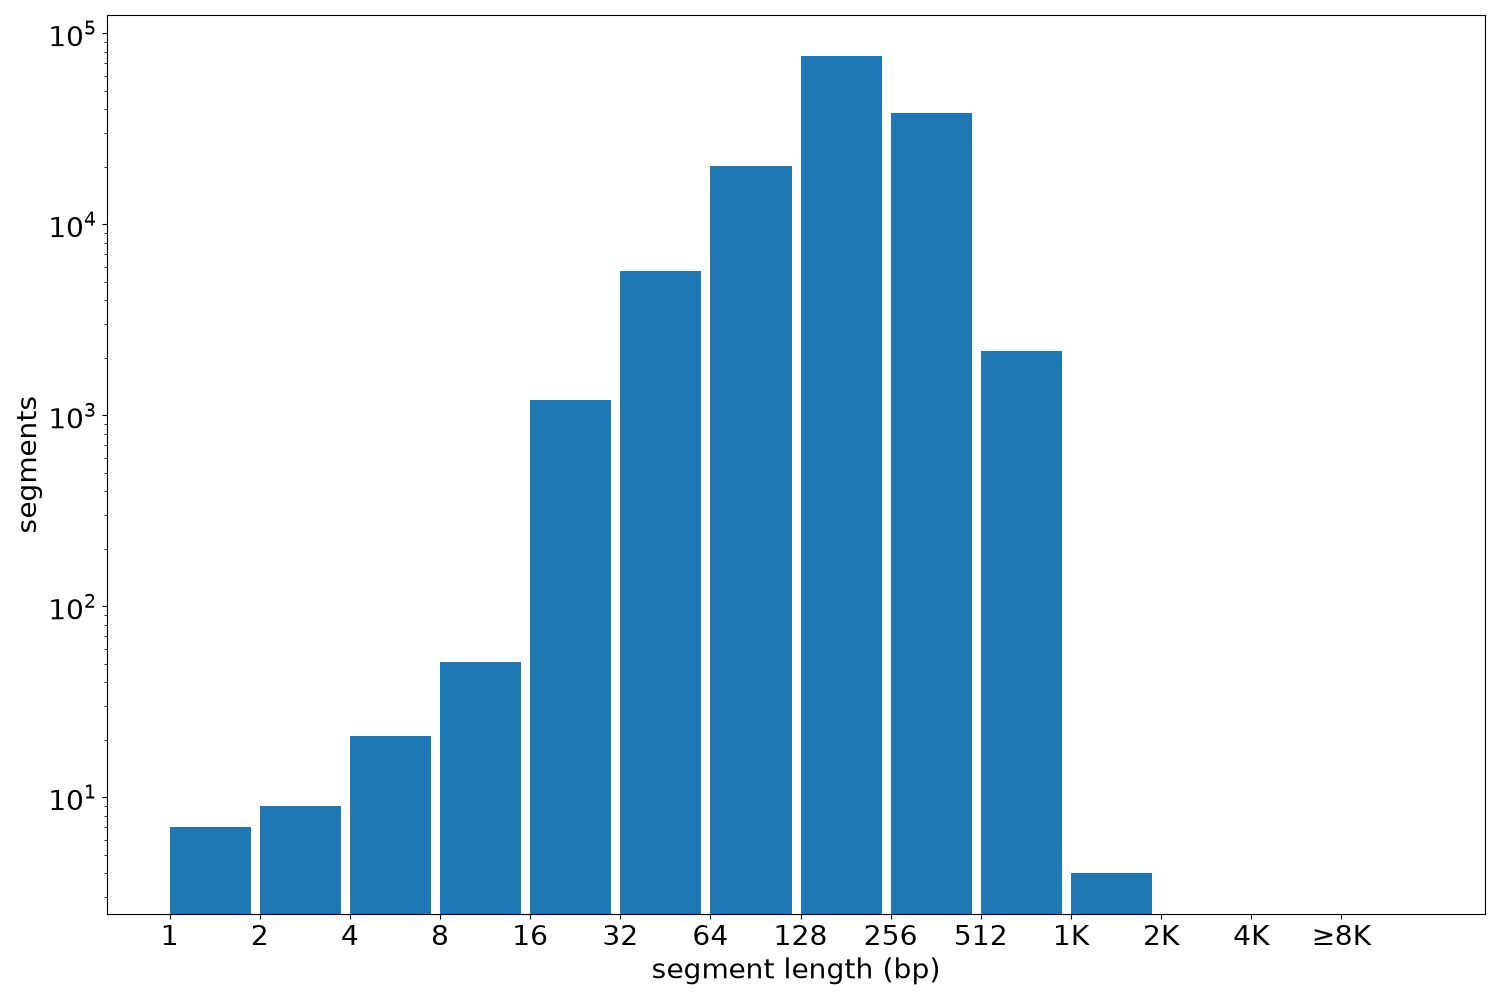
Segment lengths
| segments | min | max | mean | median | |
|---|---|---|---|---|---|
| segments | 144176 | 1 | 1080 | 215.42 | 202 |
Files
| Filename | Size | md5 |
|---|---|---|
| ENCFF880TFT.bed.gz | 1.52 MB | b9653dcf6e5d739a6abc068c23eed28c |
| ENCFF880TFT.tabix.bed.gz | 1.4 MB | bd75009b6b8121ea05c884424243fe96 |
| ENCFF880TFT.tabix.bed.gz.tbi | 528.79 KB | 0f141df7ca54d3b863bdd89da1b9ed67 |
| genomic_resource.yaml | 2.01 KB | 29c281a1f0fe44184ef0f60dcce0c49d |
| statistics/ |