Resource
| Id | DNase-seq/ENCSR818HHN |
|---|---|
| Type | position_score |
| Version | 0 |
| Summary | DNase-seq ENCSR818HHN [biosample_summary="Homo sapiens osteocyte"] |
| Description |
status: released biological_replicates: Rep 1 summary: female embryo (5 days) output_type: peaks audit_error: Signal Portion of Tags (SPOT) is a measure of enrichment, analogous to the commonly used fraction of reads in peaks metric. ENCODE processed alignment files {ENCFF039RUP|/files/ENCFF039RUP/} processed by DNase-seq ENCODE4 v3.0.0 GRCh38 pipeline ({ENCPL848KLD|/pipelines/ENCPL848KLD/}) for GRCh38 assembly have a SPOT1 score of 0.21. According to ENCODE standards, SPOT1 score of 0.4 or higher is considered a product of high quality data. Any sample with a SPOT1 score <0.3 should be targeted for replacement with a higher quality sample, and a SPOT1 score of 0.25 is considered minimally acceptable SPOT1 score of 0.25 is considered minimally acceptable for rare and hard to find primary tissues. (See {ENCODE DNase-seq data standards|/data-standards/dnase-seq-encode4/}) |
| Labels |
|
Scores (1)
| ID | Type | Default annotation | Description | Histogram | Range | Summary |
|---|---|---|---|---|---|---|
| DNase-seq_ENCSR818HHN | float |
DNase-seq_ENCSR818HHN |
DNase-seq ENCSR818HHN [biosample_summary="Homo sapiens osteocyte"]
|
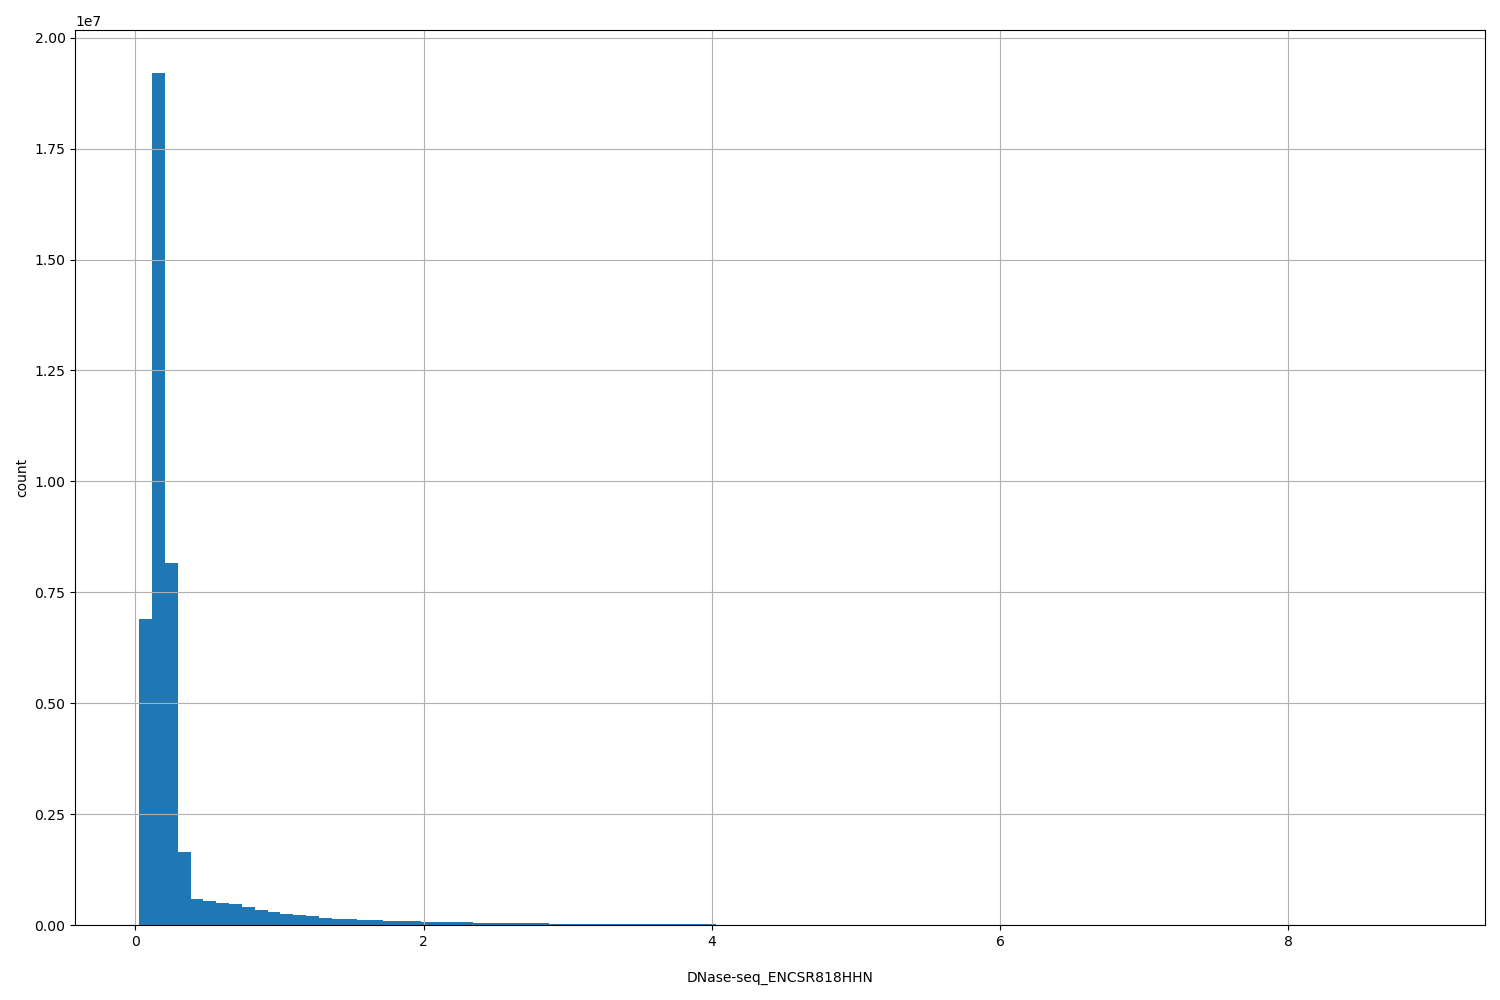 |
[0.0274, 8.92] |
|
n counts base pairs; sd is the population standard deviation.
Coverage
| Chromosome | Covered positions | Covered % | Segments |
|---|---|---|---|
| all chromosomes | 42018171 | 1.31% | 189423 |
| chr1 | 3344807 | 1.34% | 14802 |
| chr2 | 4160573 | 1.72% | 18620 |
| chr3 | 2198804 | 1.11% | 9935 |
| chr4 | 1140396 | 0.60% | 5225 |
| chr5 | 2154426 | 1.19% | 9641 |
| chr6 | 1868218 | 1.09% | 8569 |
| chr7 | 2214651 | 1.39% | 10061 |
| chr8 | 1867237 | 1.29% | 8412 |
| chr9 | 1725261 | 1.25% | 7818 |
| chr10 | 2883000 | 2.15% | 12897 |
| chr11 | 1978877 | 1.46% | 8853 |
| chr12 | 1506574 | 1.13% | 6958 |
| chr13 | 993897 | 0.87% | 4543 |
| chr14 | 1377491 | 1.29% | 6220 |
| chr15 | 1771893 | 1.74% | 8034 |
| chr16 | 1503879 | 1.66% | 7044 |
| chr17 | 1752943 | 2.11% | 8035 |
| chr18 | 1117728 | 1.39% | 5044 |
| chr19 | 1685517 | 2.88% | 7632 |
| chr20 | 1464482 | 2.27% | 6505 |
| chr21 | 745853 | 1.60% | 3260 |
| chr22 | 1251081 | 2.46% | 5404 |
| chrX | 1307614 | 0.84% | 5888 |
| chrY | 2969 | 0.01% | 23 |
| 3342 contigs with no values (129077085 bp) | 0 | 0.00% | 0 |
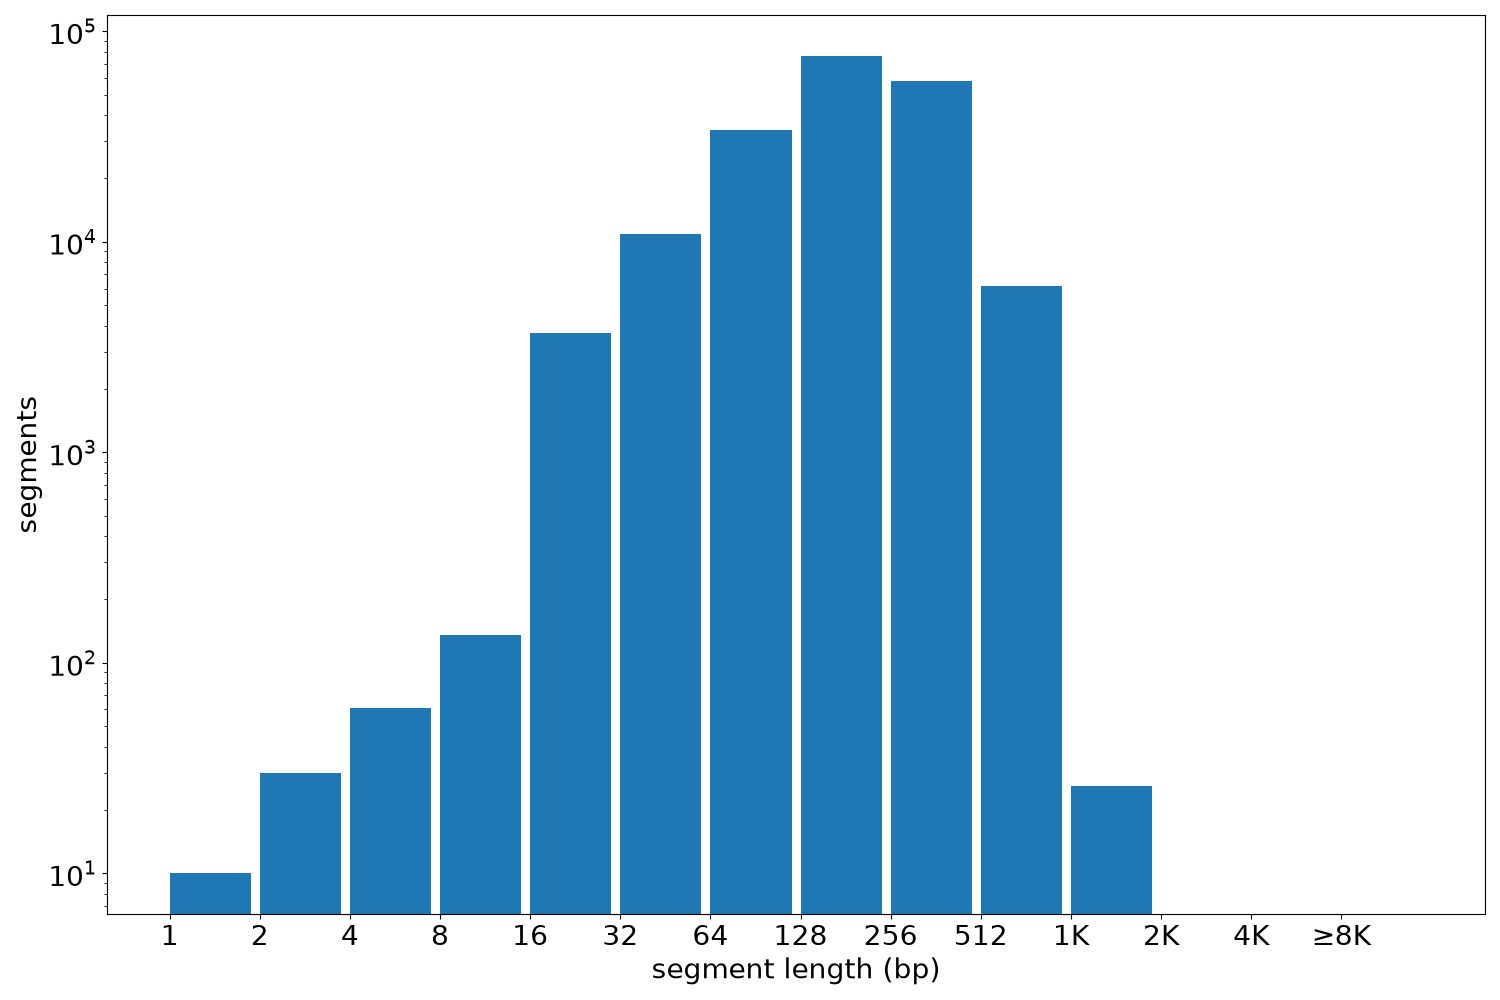
Segment lengths
| segments | min | max | mean | median | |
|---|---|---|---|---|---|
| segments | 189423 | 1 | 1480 | 221.82 | 201 |
Files
| Filename | Size | md5 |
|---|---|---|
| ENCFF669XGP.bed.gz | 1.74 MB | 647e1d598cc5257215051755b6e98a38 |
| ENCFF669XGP.tabix.bed.gz | 1.68 MB | 6b57323a16b539b4f482e970081a0e0f |
| ENCFF669XGP.tabix.bed.gz.tbi | 263.94 KB | a69b05180aa4298af1fd296d553d6ff1 |
| genomic_resource.yaml | 1.95 KB | 540ab1eb30d0d2eb5f7b6317d48daf37 |
| statistics/ |