Resource
| Id | DNase-seq/ENCSR814KRX |
|---|---|
| Type | position_score |
| Version | 0 |
| Summary | DNase-seq ENCSR814KRX [biosample_summary="Homo sapiens HT-29"] |
| Description |
status: released biological_replicates: Rep 2 summary: output_type: peaks audit_warning: Signal Portion of Tags (SPOT) is a measure of enrichment, analogous to the commonly used fraction of reads in peaks metric. ENCODE processed alignment files {ENCFF698NHT|/files/ENCFF698NHT/} processed by DNase-seq ENCODE4 v3.0.0-alpha.2 GRCh38 pipeline ({ENCPL848KLD|/pipelines/ENCPL848KLD/}) for GRCh38 assembly have a SPOT1 score of 0.38. According to ENCODE standards, SPOT1 score of 0.4 or higher is considered a product of high quality data. Any sample with a SPOT1 score <0.3 should be targeted for replacement with a higher quality sample, and a SPOT1 score of 0.25 is considered minimally acceptable SPOT1 score of 0.25 is considered minimally acceptable for rare and hard to find primary tissues. (See {ENCODE DNase-seq data standards|/data-standards/dnase-seq-encode4/}) |
| Labels |
|
Scores (1)
| ID | Type | Default annotation | Description | Histogram | Range | Summary |
|---|---|---|---|---|---|---|
| DNase-seq_ENCSR814KRX | float |
DNase-seq_ENCSR814KRX |
DNase-seq ENCSR814KRX [biosample_summary="Homo sapiens HT-29"]
|
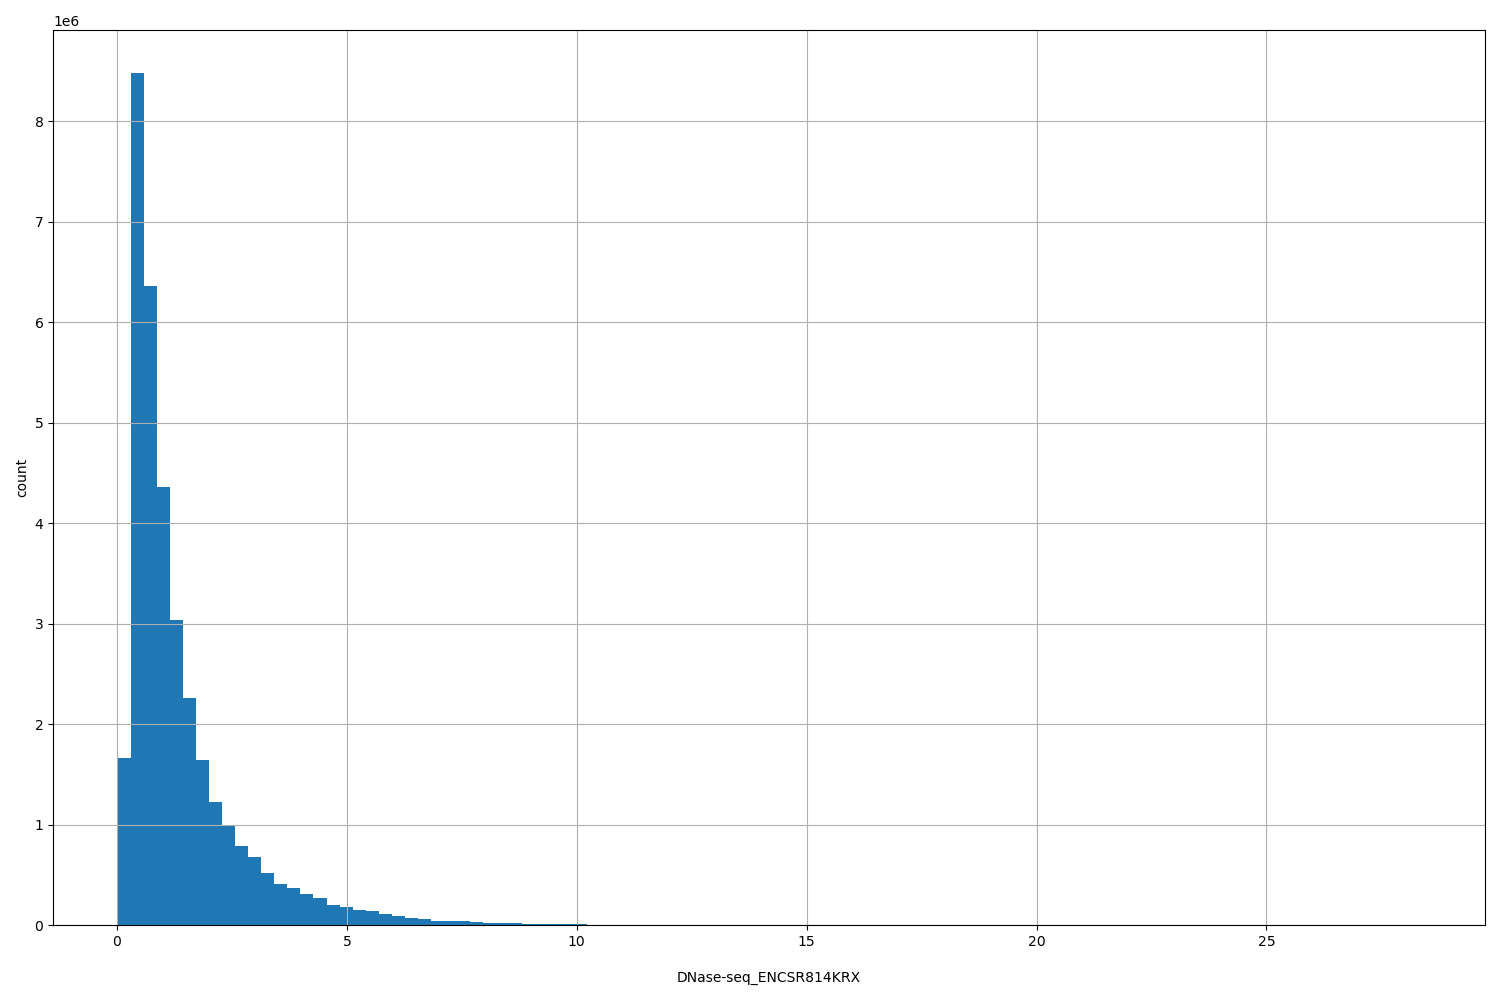 |
[0.0257, 28.3] |
|
n counts base pairs; sd is the population standard deviation.
Coverage
| Chromosome | Covered positions | Covered % | Segments |
|---|---|---|---|
| all chromosomes | 34757753 | 1.08% | 158692 |
| chr1 | 3296503 | 1.32% | 14732 |
| chr2 | 2703002 | 1.12% | 12399 |
| chr3 | 2146215 | 1.08% | 9738 |
| chr4 | 1785273 | 0.94% | 8174 |
| chr5 | 1929780 | 1.06% | 8885 |
| chr6 | 2109908 | 1.24% | 9419 |
| chr7 | 1908270 | 1.20% | 8730 |
| chr8 | 1482709 | 1.02% | 6821 |
| chr9 | 1404462 | 1.01% | 6493 |
| chr10 | 1580369 | 1.18% | 7224 |
| chr11 | 1967103 | 1.46% | 8878 |
| chr12 | 1810323 | 1.36% | 8132 |
| chr13 | 1103909 | 0.97% | 4813 |
| chr14 | 971354 | 0.91% | 4477 |
| chr15 | 1223409 | 1.20% | 5518 |
| chr16 | 1015650 | 1.12% | 4880 |
| chr17 | 1545146 | 1.86% | 6969 |
| chr18 | 659773 | 0.82% | 3093 |
| chr19 | 1227502 | 2.09% | 5671 |
| chr20 | 979947 | 1.52% | 4513 |
| chr21 | 343530 | 0.74% | 1591 |
| chr22 | 571587 | 1.12% | 2720 |
| chrX | 991034 | 0.64% | 4812 |
| chrY | 995 | <0.01% | 10 |
| 3342 contigs with no values (129077085 bp) | 0 | 0.00% | 0 |
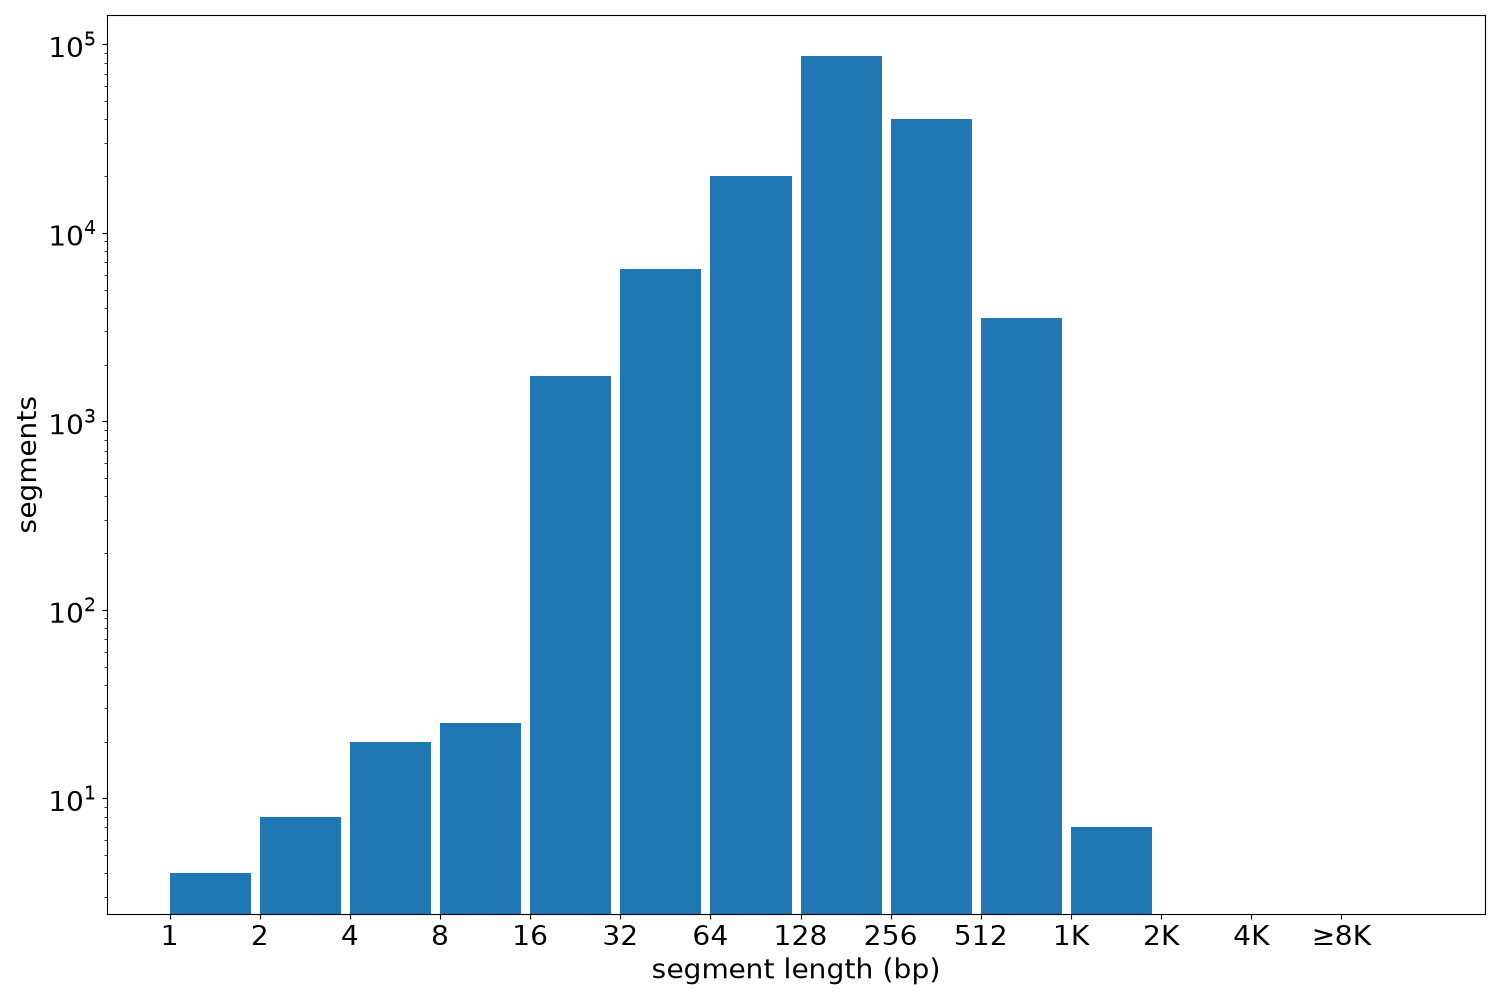
Segment lengths
| segments | min | max | mean | median | |
|---|---|---|---|---|---|
| segments | 158692 | 1 | 1260 | 219.03 | 200 |
Files
| Filename | Size | md5 |
|---|---|---|
| ENCFF094XEJ.bed.gz | 1.67 MB | 5b771762f1fc5db71e76d31311f2fc38 |
| ENCFF094XEJ.tabix.bed.gz | 1.56 MB | 87b23ed1a1fee6f531d453a3c8ed6a72 |
| ENCFF094XEJ.tabix.bed.gz.tbi | 524.29 KB | abee00e7734001f673918b6679f4da93 |
| genomic_resource.yaml | 1.91 KB | 1bd884cbea8f4f76535284602a1337ca |
| statistics/ |