Resource
| Id | DNase-seq/ENCSR802ZYE |
|---|---|
| Type | position_score |
| Version | 0 |
| Summary | DNase-seq ENCSR802ZYE [biosample_summary="Homo sapiens left lobe of liver tissue male adult (45 years)"] |
| Description |
status: released biological_replicates: Rep 1 summary: male adult (45 years) output_type: peaks audit_warning: Signal Portion of Tags (SPOT) is a measure of enrichment, analogous to the commonly used fraction of reads in peaks metric. ENCODE processed alignment files {ENCFF272CBV|/files/ENCFF272CBV/} processed by DNase-seq ENCODE4 v3.0.0-alpha.2 GRCh38 pipeline ({ENCPL848KLD|/pipelines/ENCPL848KLD/}) for GRCh38 assembly have a SPOT1 score of 0.39. According to ENCODE standards, SPOT1 score of 0.4 or higher is considered a product of high quality data. Any sample with a SPOT1 score <0.3 should be targeted for replacement with a higher quality sample, and a SPOT1 score of 0.25 is considered minimally acceptable SPOT1 score of 0.25 is considered minimally acceptable for rare and hard to find primary tissues. (See {ENCODE DNase-seq data standards|/data-standards/dnase-seq-encode4/}) |
| Labels |
|
Scores (1)
| ID | Type | Default annotation | Description | Histogram | Range | Summary |
|---|---|---|---|---|---|---|
| DNase-seq_ENCSR802ZYE | float |
DNase-seq_ENCSR802ZYE |
DNase-seq ENCSR802ZYE [biosample_summary="Homo sapiens left lobe of liver tissue male adult (45 years)"]
|
 |
[0.0307, 16.1] |
|
n counts base pairs; sd is the population standard deviation.
Coverage
| Chromosome | Covered positions | Covered % | Segments |
|---|---|---|---|
| all chromosomes | 29844884 | 0.93% | 141755 |
| chr1 | 2661500 | 1.07% | 12649 |
| chr2 | 2611251 | 1.08% | 12383 |
| chr3 | 1639976 | 0.83% | 7874 |
| chr4 | 875932 | 0.46% | 4213 |
| chr5 | 1372570 | 0.76% | 6631 |
| chr6 | 1290510 | 0.76% | 6238 |
| chr7 | 1422995 | 0.89% | 6857 |
| chr8 | 1345374 | 0.93% | 6325 |
| chr9 | 1471324 | 1.06% | 6844 |
| chr10 | 1716133 | 1.28% | 8180 |
| chr11 | 1641057 | 1.21% | 7676 |
| chr12 | 1246976 | 0.94% | 5968 |
| chr13 | 579687 | 0.51% | 2741 |
| chr14 | 1018430 | 0.95% | 4770 |
| chr15 | 1250931 | 1.23% | 5954 |
| chr16 | 1111162 | 1.23% | 5344 |
| chr17 | 1569228 | 1.88% | 7447 |
| chr18 | 643262 | 0.80% | 3076 |
| chr19 | 1281601 | 2.19% | 5930 |
| chr20 | 954133 | 1.48% | 4601 |
| chr21 | 498051 | 1.07% | 2255 |
| chr22 | 1098244 | 2.16% | 5061 |
| chrX | 514826 | 0.33% | 2580 |
| chrY | 29731 | 0.05% | 158 |
| 3342 contigs with no values (129077085 bp) | 0 | 0.00% | 0 |
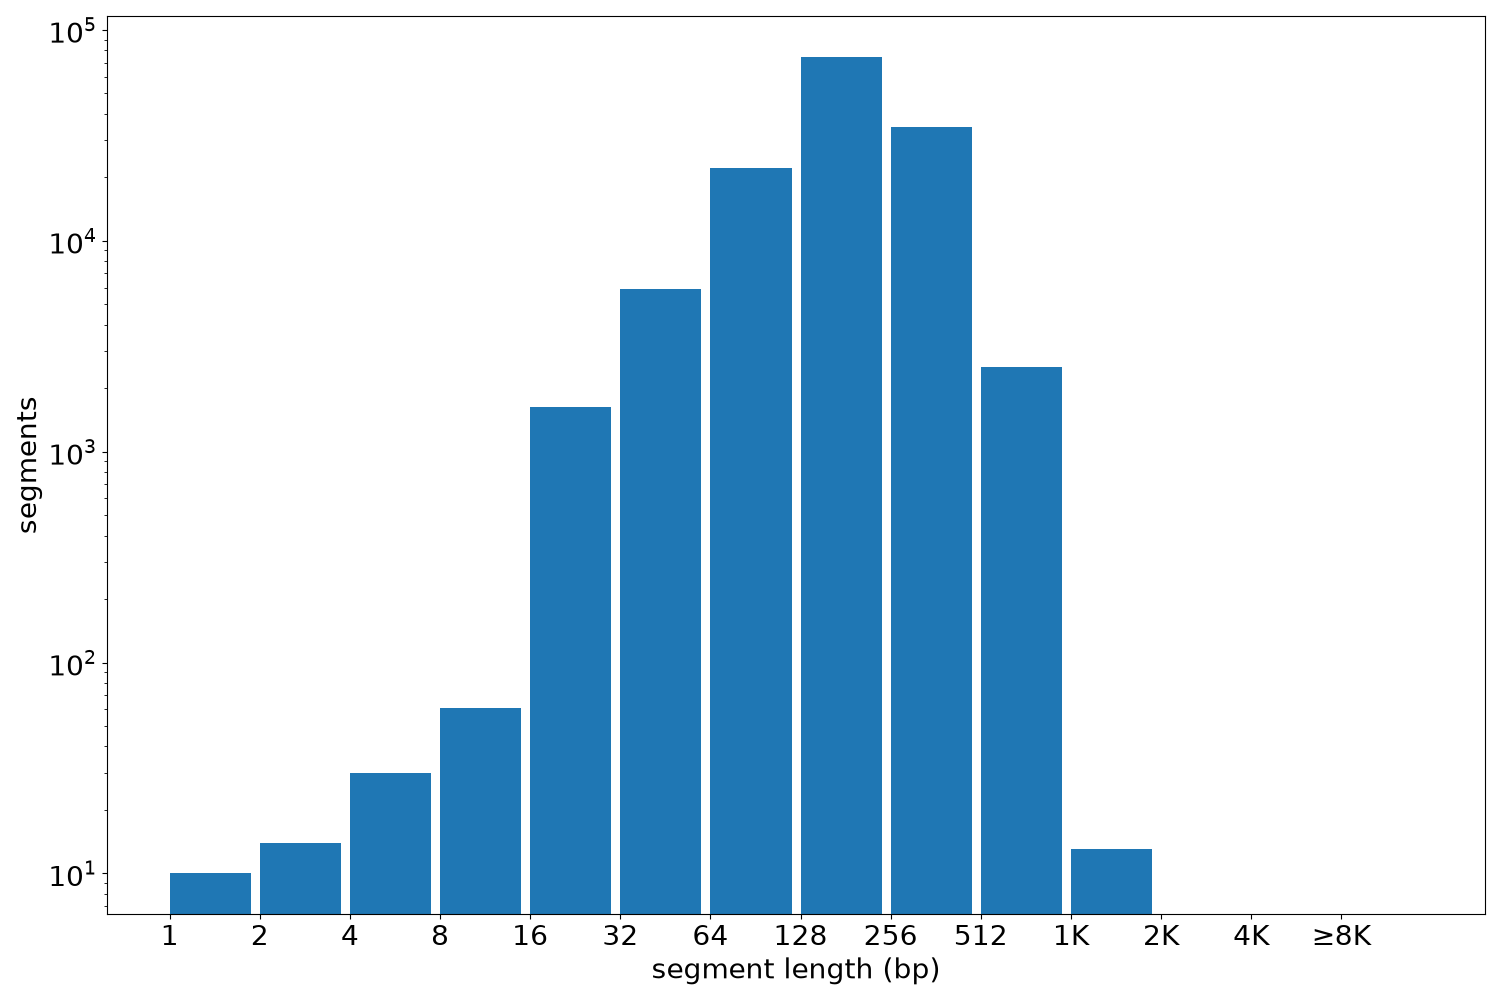
Segment lengths
| segments | min | max | mean | median | |
|---|---|---|---|---|---|
| segments | 141755 | 1 | 1383 | 210.54 | 200 |
Files
| Filename | Size | md5 |
|---|---|---|
| ENCFF644RPH.bed.gz | 1.44 MB | 6e33e46da22fd0d9cd1e474a72c8fa1f |
| ENCFF644RPH.tabix.bed.gz | 1.34 MB | 4f6fc40cfc1dac47ccae266576d48968 |
| ENCFF644RPH.tabix.bed.gz.tbi | 337.1 KB | 87cabf453a43d10054bb303e1dc52950 |
| genomic_resource.yaml | 2.05 KB | 325f5650276100395c06ccac982df3ee |
| statistics/ |