Resource
| Id | DNase-seq/ENCSR794TLA |
|---|---|
| Type | position_score |
| Version | 0 |
| Summary | DNase-seq ENCSR794TLA [biosample_summary="Homo sapiens natural killer cell female adult (41 years) treated with 100 ng/mL Interleukin-12 subunit alpha for 72 hours, 100 ng/mL Interleukin-15 for 72 hours, 100 ng/mL Interleukin-12 subunit beta for 72 hours, 100 ng/mL Interleukin-18 for 72 hours"] |
| Description |
status: released biological_replicates: Rep 1 summary: female adult (41 years) treated with 100 ng/mL Interleukin-12 subunit alpha for 72 hours, 100 ng/mL Interleukin-15 for 72 hours, 100 ng/mL Interleukin-12 subunit beta for 72 hours, 100 ng/mL Interleukin-18 for 72 hours output_type: peaks audit_warning: Signal Portion of Tags (SPOT) is a measure of enrichment, analogous to the commonly used fraction of reads in peaks metric. ENCODE processed alignment files {ENCFF356WSQ|/files/ENCFF356WSQ/} processed by DNase-seq ENCODE4 v3.0.0 GRCh38 pipeline ({ENCPL848KLD|/pipelines/ENCPL848KLD/}) for GRCh38 assembly have a SPOT1 score of 0.36. According to ENCODE standards, SPOT1 score of 0.4 or higher is considered a product of high quality data. Any sample with a SPOT1 score <0.3 should be targeted for replacement with a higher quality sample, and a SPOT1 score of 0.25 is considered minimally acceptable SPOT1 score of 0.25 is considered minimally acceptable for rare and hard to find primary tissues. (See {ENCODE DNase-seq data standards|/data-standards/dnase-seq-encode4/}) |
| Labels |
|
Scores (1)
| ID | Type | Default annotation | Description | Histogram | Range | Summary |
|---|---|---|---|---|---|---|
| DNase-seq_ENCSR794TLA | float |
DNase-seq_ENCSR794TLA |
DNase-seq ENCSR794TLA [biosample_summary="Homo sapiens natural killer cell female adult (41 years) treated with 100 ng/mL Interleukin-12 subunit alpha for 72 hours, 100 ng/mL Interleukin-15 for 72 hours, 100 ng/mL Interleukin-12 subunit beta for 72 hours, 100 ng/mL Interleukin-18 for 72 hours"]
|
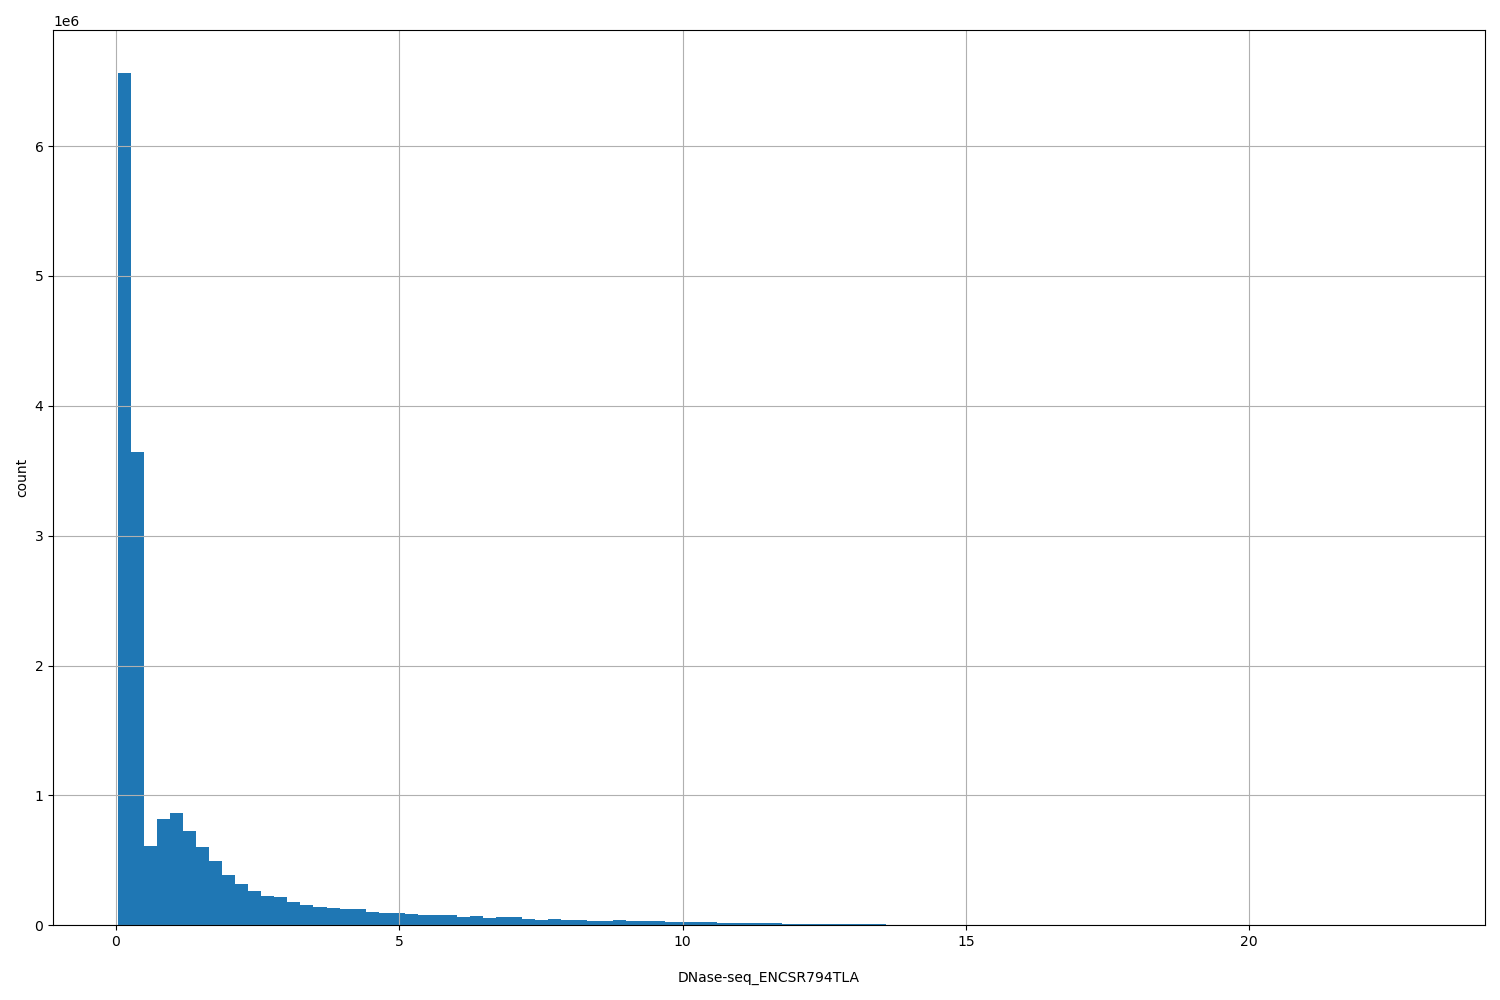 |
[0.0414, 23] |
|
n counts base pairs; sd is the population standard deviation.
Coverage
| Chromosome | Covered positions | Covered % | Segments |
|---|---|---|---|
| all chromosomes | 18309414 | 0.57% | 104356 |
| chr1 | 1850907 | 0.74% | 10486 |
| chr2 | 1387362 | 0.57% | 8046 |
| chr3 | 872472 | 0.44% | 4988 |
| chr4 | 619515 | 0.33% | 3450 |
| chr5 | 760930 | 0.42% | 4368 |
| chr6 | 743191 | 0.44% | 4159 |
| chr7 | 955894 | 0.60% | 5484 |
| chr8 | 780389 | 0.54% | 4449 |
| chr9 | 746646 | 0.54% | 4219 |
| chr10 | 908244 | 0.68% | 5265 |
| chr11 | 1034337 | 0.77% | 5911 |
| chr12 | 778873 | 0.58% | 4455 |
| chr13 | 234199 | 0.20% | 1297 |
| chr14 | 616271 | 0.58% | 3536 |
| chr15 | 623665 | 0.61% | 3593 |
| chr16 | 896975 | 0.99% | 5112 |
| chr17 | 1203384 | 1.45% | 6856 |
| chr18 | 259791 | 0.32% | 1497 |
| chr19 | 1073363 | 1.83% | 5850 |
| chr20 | 661252 | 1.03% | 3863 |
| chr21 | 311915 | 0.67% | 1755 |
| chr22 | 642237 | 1.26% | 3751 |
| chrX | 346153 | 0.22% | 1950 |
| chrY | 1449 | <0.01% | 16 |
| 3342 contigs with no values (129077085 bp) | 0 | 0.00% | 0 |
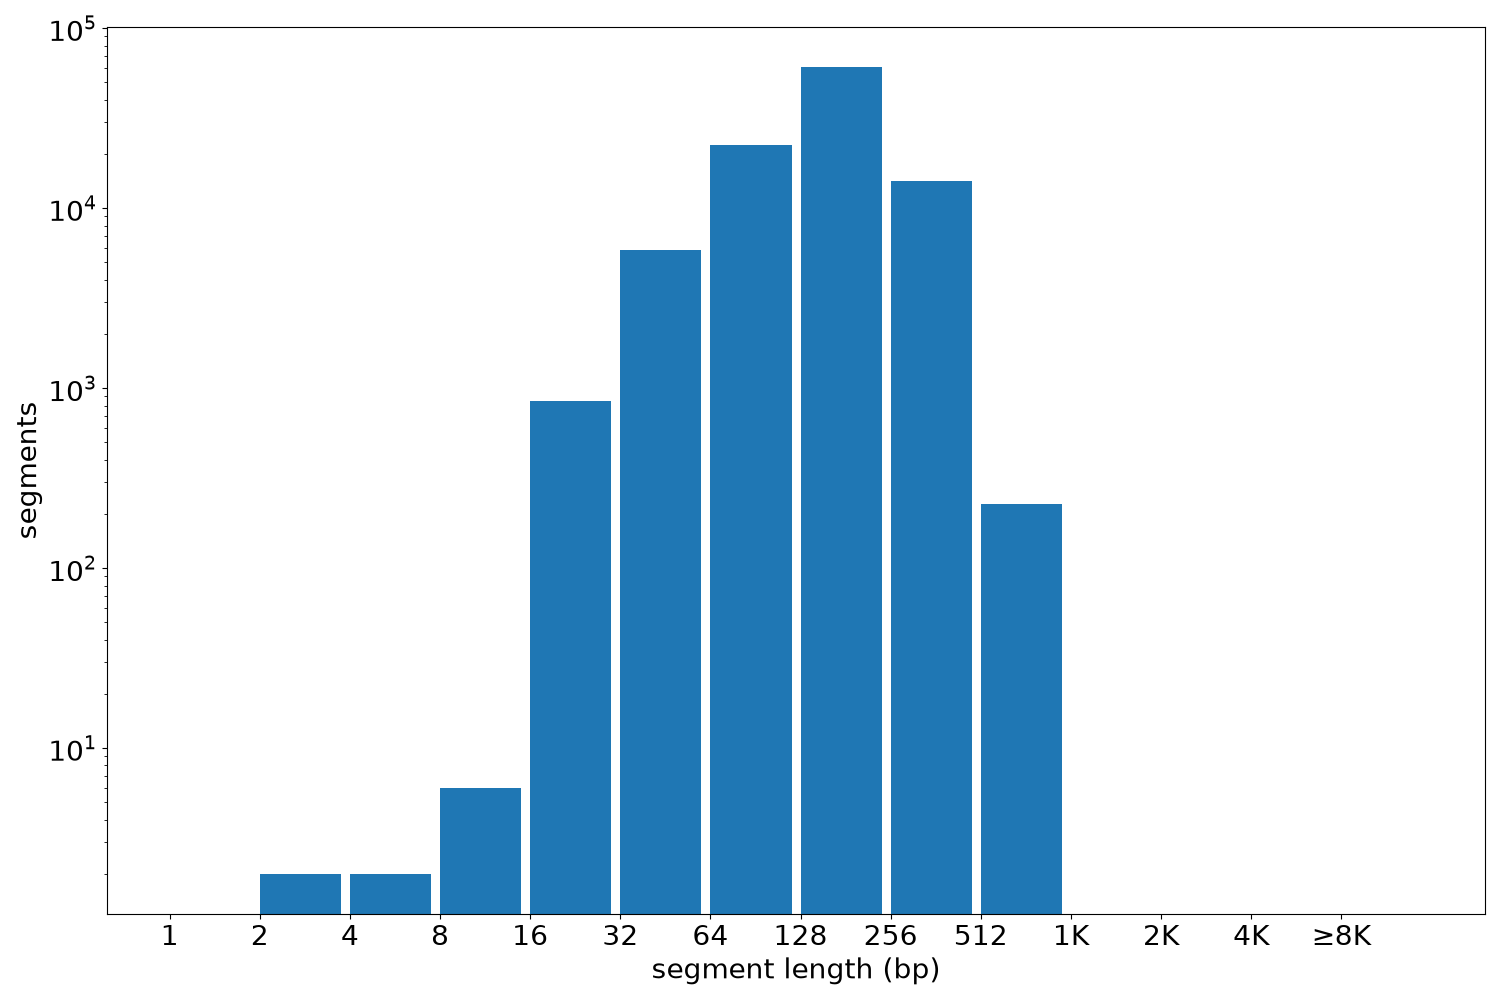
Segment lengths
| segments | min | max | mean | median | |
|---|---|---|---|---|---|
| segments | 104356 | 2 | 880 | 175.45 | 176 |
Files
| Filename | Size | md5 |
|---|---|---|
| ENCFF829XGX.bed.gz | 1.05 MB | 34e2fd80b2174394eac937648b260ccd |
| ENCFF829XGX.tabix.bed.gz | 985.91 KB | eb1f290ce90d3bf14caf5d1f0d37cb51 |
| ENCFF829XGX.tabix.bed.gz.tbi | 235.92 KB | fea880cd2653eb67fd263bddee316280 |
| genomic_resource.yaml | 3.03 KB | 8a46d31c56220829c39590d41379535c |
| statistics/ |