Resource
| Id | DNase-seq/ENCSR789FJF |
|---|---|
| Type | position_score |
| Version | 0 |
| Summary | DNase-seq ENCSR789FJF [biosample_summary="Homo sapiens posterior cingulate gyrus tissue female adult (87 years)"] |
| Description |
status: released biological_replicates: Rep 1 summary: female adult (87 years) output_type: peaks audit_warning: Signal Portion of Tags (SPOT) is a measure of enrichment, analogous to the commonly used fraction of reads in peaks metric. ENCODE processed alignment files {ENCFF238FDV|/files/ENCFF238FDV/} processed by DNase-seq ENCODE4 v3.0.0 GRCh38 pipeline ({ENCPL848KLD|/pipelines/ENCPL848KLD/}) for GRCh38 assembly have a SPOT1 score of 0.37. According to ENCODE standards, SPOT1 score of 0.4 or higher is considered a product of high quality data. Any sample with a SPOT1 score <0.3 should be targeted for replacement with a higher quality sample, and a SPOT1 score of 0.25 is considered minimally acceptable SPOT1 score of 0.25 is considered minimally acceptable for rare and hard to find primary tissues. (See {ENCODE DNase-seq data standards|/data-standards/dnase-seq-encode4/}) |
| Labels |
|
Scores (1)
| ID | Type | Default annotation | Description | Histogram | Range | Summary |
|---|---|---|---|---|---|---|
| DNase-seq_ENCSR789FJF | float |
DNase-seq_ENCSR789FJF |
DNase-seq ENCSR789FJF [biosample_summary="Homo sapiens posterior cingulate gyrus tissue female adult (87 years)"]
|
 |
[0.0572, 17.1] |
|
n counts base pairs; sd is the population standard deviation.
Coverage
| Chromosome | Covered positions | Covered % | Segments |
|---|---|---|---|
| all chromosomes | 14404400 | 0.45% | 76111 |
| chr1 | 1322947 | 0.53% | 6991 |
| chr2 | 1164357 | 0.48% | 6198 |
| chr3 | 737485 | 0.37% | 3974 |
| chr4 | 495347 | 0.26% | 2589 |
| chr5 | 672097 | 0.37% | 3582 |
| chr6 | 656443 | 0.38% | 3501 |
| chr7 | 718813 | 0.45% | 3814 |
| chr8 | 667230 | 0.46% | 3535 |
| chr9 | 658897 | 0.48% | 3490 |
| chr10 | 771228 | 0.58% | 4064 |
| chr11 | 864428 | 0.64% | 4530 |
| chr12 | 629275 | 0.47% | 3320 |
| chr13 | 271093 | 0.24% | 1489 |
| chr14 | 487878 | 0.46% | 2618 |
| chr15 | 523919 | 0.51% | 2796 |
| chr16 | 538850 | 0.60% | 2835 |
| chr17 | 773341 | 0.93% | 4086 |
| chr18 | 265505 | 0.33% | 1416 |
| chr19 | 690920 | 1.18% | 3446 |
| chr20 | 494819 | 0.77% | 2611 |
| chr21 | 228728 | 0.49% | 1217 |
| chr22 | 472821 | 0.93% | 2421 |
| chrX | 296889 | 0.19% | 1579 |
| chrY | 1090 | <0.01% | 9 |
| 3342 contigs with no values (129077085 bp) | 0 | 0.00% | 0 |
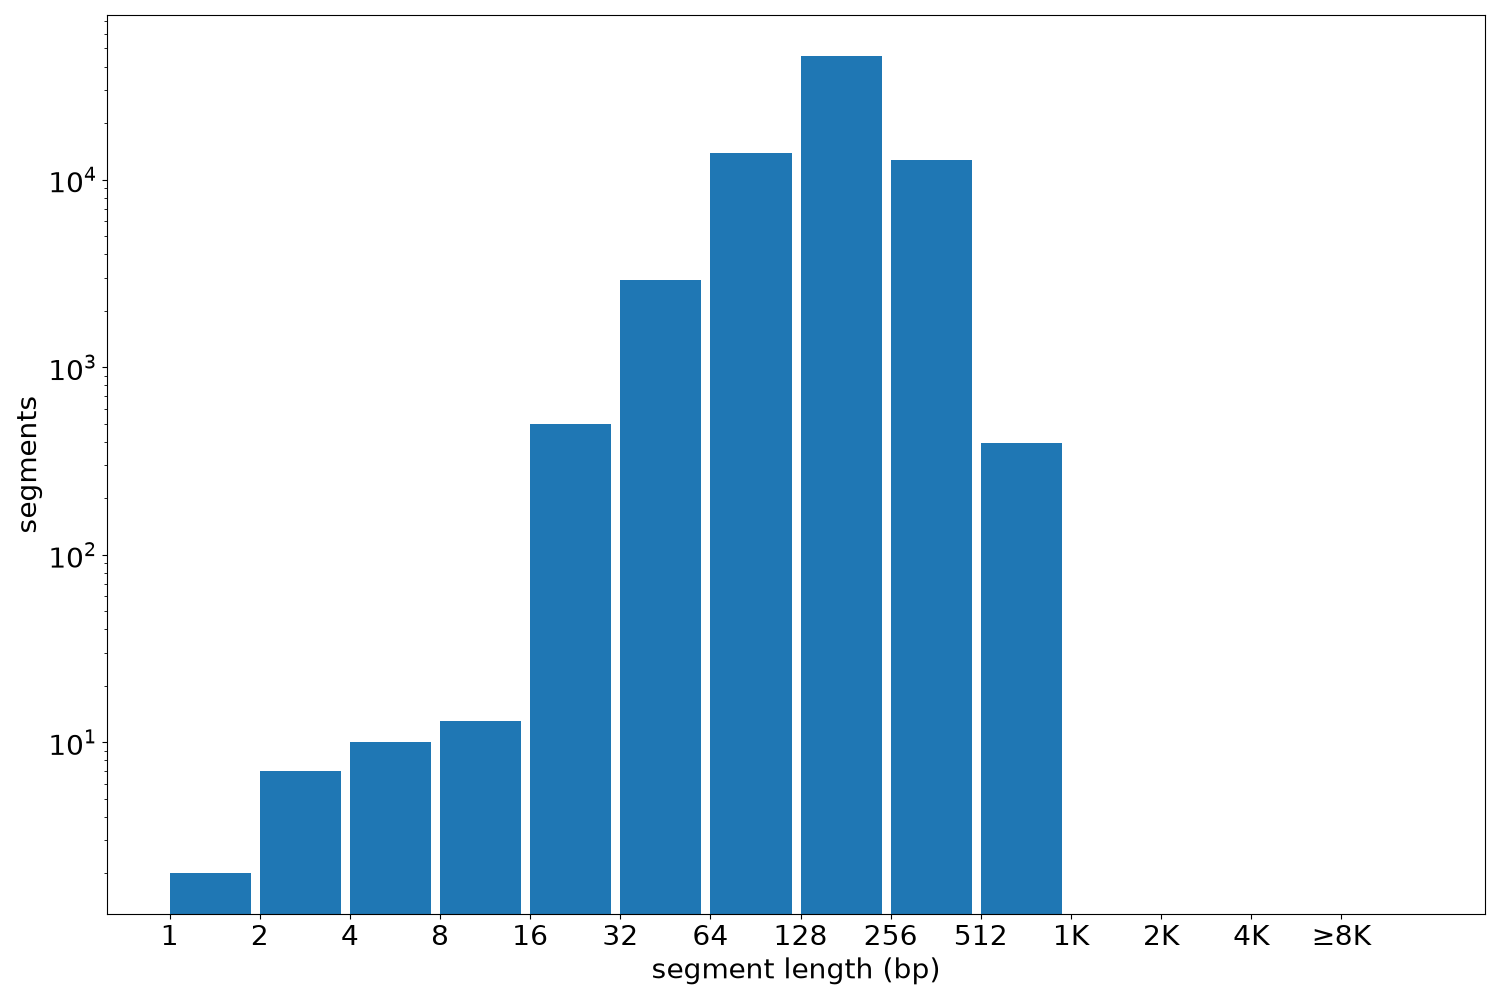
Segment lengths
| segments | min | max | mean | median | |
|---|---|---|---|---|---|
| segments | 76111 | 1 | 960 | 189.26 | 180 |
Files
| Filename | Size | md5 |
|---|---|---|
| ENCFF280SAO.bed.gz | 819.09 KB | 0cf4cf0b58b6434b4c9c4d18fbf959a7 |
| ENCFF280SAO.tabix.bed.gz | 745.7 KB | d0f3e6bb44fdcb7f93f4564448827f07 |
| ENCFF280SAO.tabix.bed.gz.tbi | 281.1 KB | 9de2547551556dd1fa21a874b91181fb |
| genomic_resource.yaml | 2.08 KB | 804a60127f94fcf0bbfb5b1edf96e5fd |
| statistics/ |