Resource
| Id | DNase-seq/ENCSR780ABS |
|---|---|
| Type | position_score |
| Version | 0 |
| Summary | DNase-seq ENCSR780ABS [biosample_summary="Homo sapiens activated T-helper 2 cell\ \ male adult (35 years) treated with 5 \u03BCg/mL Interferon-gamma antibody for\ \ 36 hours, anti-CD3 and anti-CD28 coated beads for 24 hours, 10 ng/mL Interleukin-2\ \ for 14 days, anti-CD3 and anti-CD28 coated beads for 14 days, 100 ng/mL Interleukin-4\ \ for 36 hours"] |
| Description |
status: released biological_replicates: Rep 1 summary: male adult (35 years) treated with 5 μg/mL Interferon-gamma antibody for 36 hours, anti-CD3 and anti-CD28 coated beads for 24 hours, 10 ng/mL Interleukin-2 for 14 days, anti-CD3 and anti-CD28 coated beads for 14 days, 100 ng/mL Interleukin-4 for 36 hours output_type: peaks audit_warning: Signal Portion of Tags (SPOT) is a measure of enrichment, analogous to the commonly used fraction of reads in peaks metric. ENCODE processed alignment files {ENCFF612MMX|/files/ENCFF612MMX/} processed by DNase-seq ENCODE4 v3.0.0 GRCh38 pipeline ({ENCPL848KLD|/pipelines/ENCPL848KLD/}) for GRCh38 assembly have a SPOT1 score of 0.39. According to ENCODE standards, SPOT1 score of 0.4 or higher is considered a product of high quality data. Any sample with a SPOT1 score <0.3 should be targeted for replacement with a higher quality sample, and a SPOT1 score of 0.25 is considered minimally acceptable SPOT1 score of 0.25 is considered minimally acceptable for rare and hard to find primary tissues. (See {ENCODE DNase-seq data standards|/data-standards/dnase-seq-encode4/}) |
| Labels |
|
Scores (1)
| ID | Type | Default annotation | Description | Histogram | Range | Summary |
|---|---|---|---|---|---|---|
| DNase-seq_ENCSR780ABS | float |
DNase-seq_ENCSR780ABS |
DNase-seq ENCSR780ABS [biosample_summary="Homo sapiens activated T-helper 2 cell\ \ male adult (35 years) treated with 5 \u03BCg/mL Interferon-gamma antibody for\ \ 36 hours, anti-CD3 and anti-CD28 coated beads for 24 hours, 10 ng/mL Interleukin-2\ \ for 14 days, anti-CD3 and anti-CD28 coated beads for 14 days, 100 ng/mL Interleukin-4\ \ for 36 hours"]
|
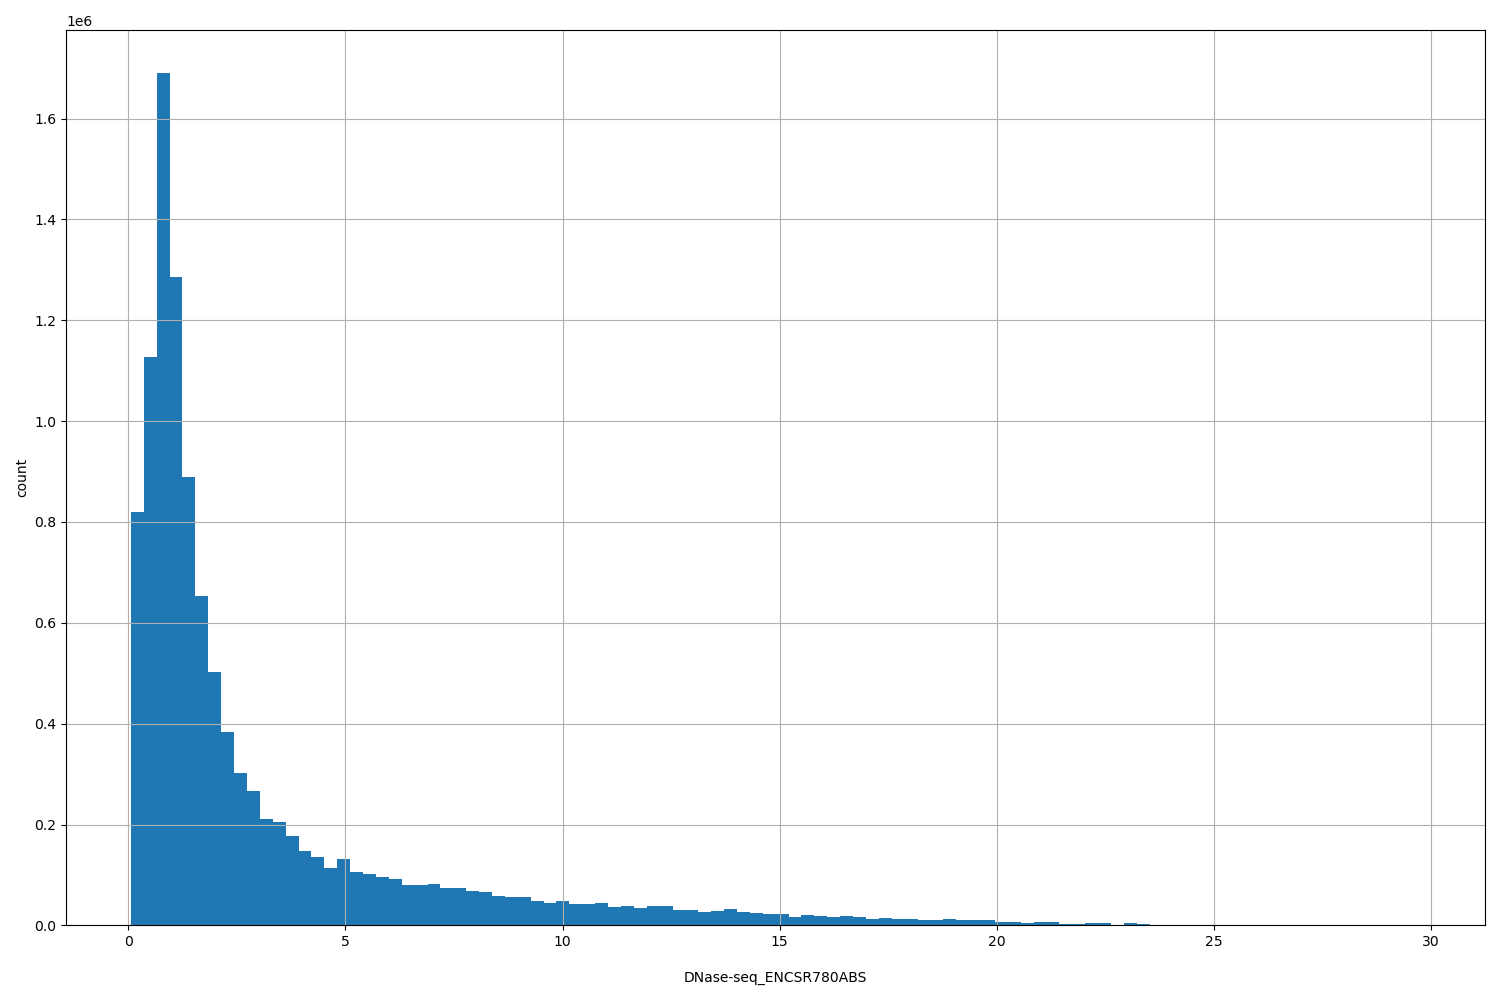 |
[0.0594, 29.8] |
|
n counts base pairs; sd is the population standard deviation.
Coverage
| Chromosome | Covered positions | Covered % | Segments |
|---|---|---|---|
| all chromosomes | 11126607 | 0.35% | 53095 |
| chr1 | 1110687 | 0.45% | 5286 |
| chr2 | 794894 | 0.33% | 3849 |
| chr3 | 601712 | 0.30% | 2860 |
| chr4 | 367983 | 0.19% | 1743 |
| chr5 | 507265 | 0.28% | 2417 |
| chr6 | 642408 | 0.38% | 2995 |
| chr7 | 490096 | 0.31% | 2372 |
| chr8 | 419190 | 0.29% | 2037 |
| chr9 | 478995 | 0.35% | 2286 |
| chr10 | 525541 | 0.39% | 2546 |
| chr11 | 559554 | 0.41% | 2715 |
| chr12 | 554164 | 0.42% | 2630 |
| chr13 | 207668 | 0.18% | 990 |
| chr14 | 383723 | 0.36% | 1833 |
| chr15 | 398259 | 0.39% | 1923 |
| chr16 | 448690 | 0.50% | 2130 |
| chr17 | 683853 | 0.82% | 3202 |
| chr18 | 165247 | 0.21% | 801 |
| chr19 | 670599 | 1.14% | 3122 |
| chr20 | 323283 | 0.50% | 1536 |
| chr21 | 143511 | 0.31% | 708 |
| chr22 | 292730 | 0.58% | 1412 |
| chrX | 343102 | 0.22% | 1641 |
| chrY | 13453 | 0.02% | 61 |
| 3342 contigs with no values (129077085 bp) | 0 | 0.00% | 0 |
Segment lengths
| segments | min | max | mean | median | |
|---|---|---|---|---|---|
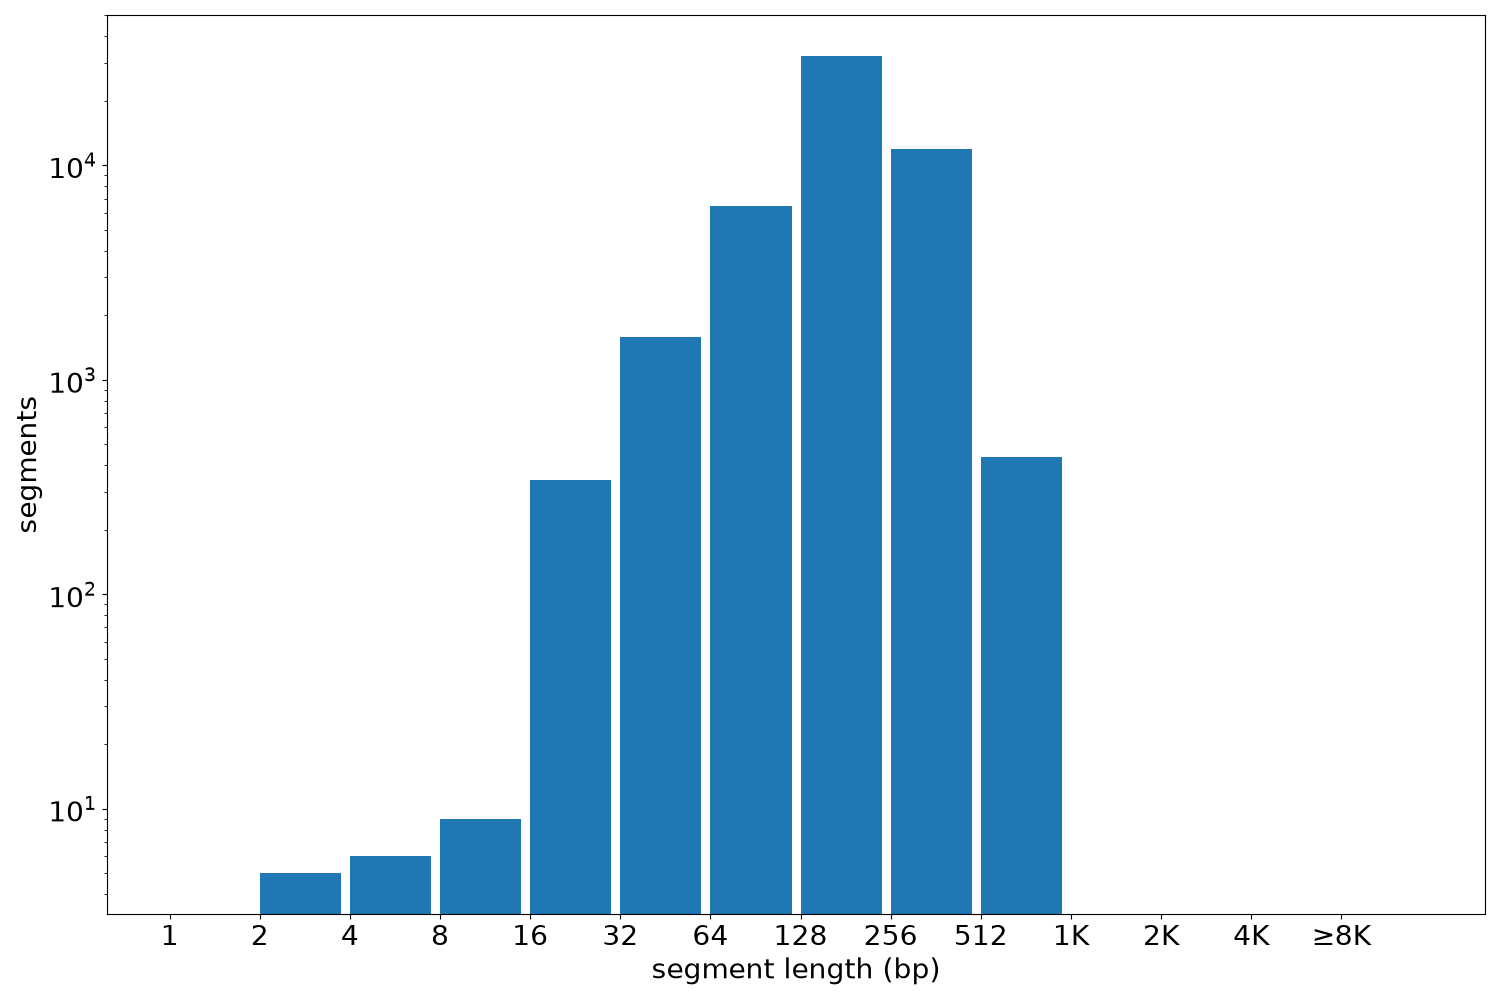
| segments | 53095 | 2 | 1003 | 209.56 | 200 |
Files
| Filename | Size | md5 |
|---|---|---|
| ENCFF953XXF.bed.gz | 592.41 KB | 2a5ac8de562457c3b7ad811d52fd820e |
| ENCFF953XXF.tabix.bed.gz | 542.44 KB | 982463744d3bf6ccc1fe6252acfa31bc |
| ENCFF953XXF.tabix.bed.gz.tbi | 239.16 KB | 6e5824dfd087ad31c165694a6503ae0f |
| genomic_resource.yaml | 3.34 KB | 0450a59a2a76f0746c7daa4e1d1b7127 |
| statistics/ |