Resource
| Id | DNase-seq/ENCSR760QZM |
|---|---|
| Type | position_score |
| Version | 0 |
| Summary | DNase-seq ENCSR760QZM [biosample_summary="Homo sapiens transverse colon tissue female adult (51 years)"] |
| Description |
status: released biological_replicates: Rep 1 summary: female adult (51 years) output_type: peaks audit_internal_action: Archived analysis {ENCAN915SCV|/analyses/ENCAN915SCV/} has in progress subobject quality standard {encode3-dnase|/quality-standards/encode3-dnase/} audit_warning: Signal Portion of Tags (SPOT) is a measure of enrichment, analogous to the commonly used fraction of reads in peaks metric. ENCODE processed alignment files {ENCFF867BHQ|/files/ENCFF867BHQ/} processed by DNase-seq ENCODE3 GRCh38 pipeline ({ENCPL202DNS|/pipelines/ENCPL202DNS/}) for GRCh38 assembly have a SPOT1 score of 0.28. According to ENCODE standards, SPOT1 score of 0.4 or higher is considered a product of high quality data. Any sample with a SPOT1 score <0.3 should be targeted for replacement with a higher quality sample, and a SPOT1 score of 0.25 is considered minimally acceptable SPOT1 score of 0.25 is considered minimally acceptable for rare and hard to find primary tissues. (See {ENCODE DNase-seq data standards|/data-standards/dnase-seq/}) |
| Labels |
|
Scores (1)
| ID | Type | Default annotation | Description | Histogram | Range | Summary |
|---|---|---|---|---|---|---|
| DNase-seq_ENCSR760QZM | float |
DNase-seq_ENCSR760QZM |
DNase-seq ENCSR760QZM [biosample_summary="Homo sapiens transverse colon tissue female adult (51 years)"]
|
 |
[1, 7.54e+03] |
|
n counts base pairs; sd is the population standard deviation.
Coverage
| Chromosome | Covered positions | Covered % | Segments |
|---|---|---|---|
| all chromosomes | 28189068 | 0.88% | 186944 |
| chr1 | 2587817 | 1.04% | 17180 |
| chr2 | 2655453 | 1.10% | 17580 |
| chr3 | 1662180 | 0.84% | 11018 |
| chr4 | 936887 | 0.49% | 6227 |
| chr5 | 1431784 | 0.79% | 9481 |
| chr6 | 1579433 | 0.92% | 10480 |
| chr7 | 1366184 | 0.86% | 9059 |
| chr8 | 1265745 | 0.87% | 8392 |
| chr9 | 1213649 | 0.88% | 8051 |
| chr10 | 1798129 | 1.34% | 11927 |
| chr11 | 1501747 | 1.11% | 9961 |
| chr12 | 1127829 | 0.85% | 7489 |
| chr13 | 712935 | 0.62% | 4726 |
| chr14 | 864532 | 0.81% | 5739 |
| chr15 | 1080793 | 1.06% | 7166 |
| chr16 | 918969 | 1.02% | 6091 |
| chr17 | 1110095 | 1.33% | 7381 |
| chr18 | 724289 | 0.90% | 4797 |
| chr19 | 995867 | 1.70% | 6610 |
| chr20 | 915903 | 1.42% | 6067 |
| chr21 | 427484 | 0.92% | 2837 |
| chr22 | 576769 | 1.13% | 3828 |
| chrX | 720195 | 0.46% | 4762 |
| chrY | 14400 | 0.03% | 95 |
| 3342 contigs with no values (129077085 bp) | 0 | 0.00% | 0 |
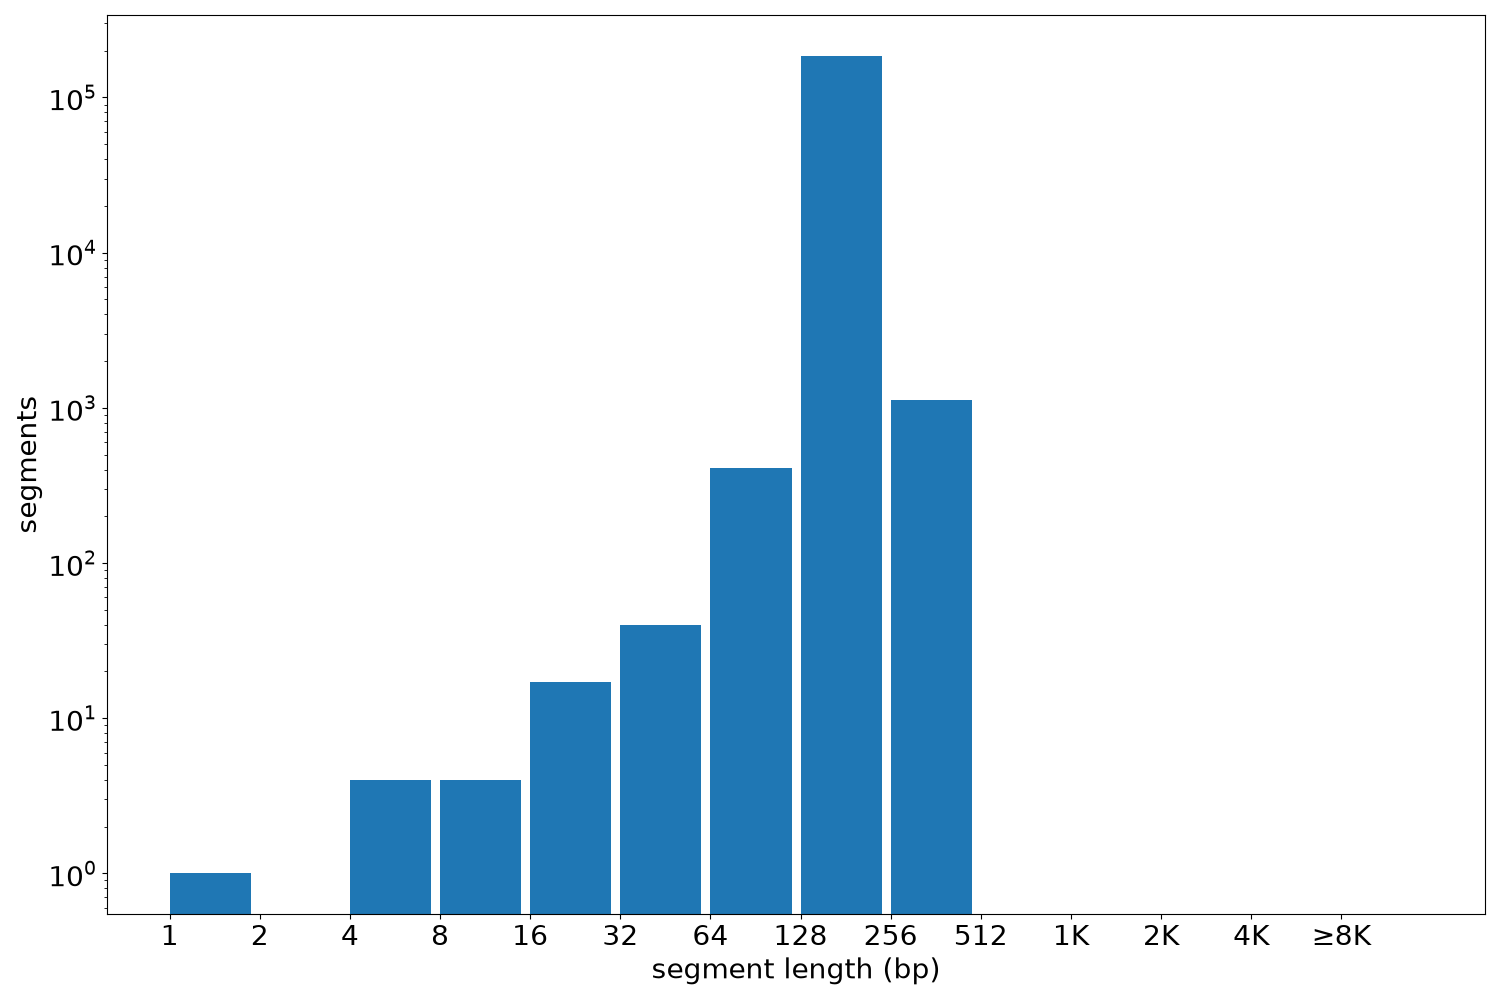
Segment lengths
| segments | min | max | mean | median | |
|---|---|---|---|---|---|
| segments | 186944 | 1 | 460 | 150.79 | 150 |
Files
| Filename | Size | md5 |
|---|---|---|
| ENCFF159SOA.bed.gz | 1.71 MB | 0a13a110738025c492ea4ceadc4d8f54 |
| ENCFF159SOA.tabix.bed.gz | 1.48 MB | 9c14b7a9d59a7e87e49cd921339ba686 |
| ENCFF159SOA.tabix.bed.gz.tbi | 387.18 KB | 9182dbe7cb594431e28017b978028682 |
| genomic_resource.yaml | 2.21 KB | 5ae79cbcfb139d9d24405de5e52ad30a |
| statistics/ |