Resource
| Id | DNase-seq/ENCSR731KDL |
|---|---|
| Type | position_score |
| Version | 0 |
| Summary | DNase-seq ENCSR731KDL [biosample_summary="Homo sapiens T-helper 17 cell male adult (48 years)"] |
| Description |
status: released biological_replicates: Rep 1 summary: male adult (48 years) output_type: peaks audit_warning: Signal Portion of Tags (SPOT) is a measure of enrichment, analogous to the commonly used fraction of reads in peaks metric. ENCODE processed alignment files {ENCFF228KAA|/files/ENCFF228KAA/} processed by DNase-seq ENCODE4 v3.0.0 GRCh38 pipeline ({ENCPL848KLD|/pipelines/ENCPL848KLD/}) for GRCh38 assembly have a SPOT1 score of 0.39. According to ENCODE standards, SPOT1 score of 0.4 or higher is considered a product of high quality data. Any sample with a SPOT1 score <0.3 should be targeted for replacement with a higher quality sample, and a SPOT1 score of 0.25 is considered minimally acceptable SPOT1 score of 0.25 is considered minimally acceptable for rare and hard to find primary tissues. (See {ENCODE DNase-seq data standards|/data-standards/dnase-seq-encode4/}) |
| Labels |
|
Scores (1)
| ID | Type | Default annotation | Description | Histogram | Range | Summary |
|---|---|---|---|---|---|---|
| DNase-seq_ENCSR731KDL | float |
DNase-seq_ENCSR731KDL |
DNase-seq ENCSR731KDL [biosample_summary="Homo sapiens T-helper 17 cell male adult (48 years)"]
|
 |
[0.0512, 32.5] |
|
n counts base pairs; sd is the population standard deviation.
Coverage
| Chromosome | Covered positions | Covered % | Segments |
|---|---|---|---|
| all chromosomes | 10451986 | 0.32% | 55946 |
| chr1 | 1041885 | 0.42% | 5516 |
| chr2 | 753055 | 0.31% | 4060 |
| chr3 | 560436 | 0.28% | 3001 |
| chr4 | 338703 | 0.18% | 1838 |
| chr5 | 502647 | 0.28% | 2698 |
| chr6 | 570449 | 0.33% | 3028 |
| chr7 | 504665 | 0.32% | 2720 |
| chr8 | 409499 | 0.28% | 2198 |
| chr9 | 410772 | 0.30% | 2219 |
| chr10 | 488113 | 0.36% | 2654 |
| chr11 | 549483 | 0.41% | 2949 |
| chr12 | 501455 | 0.38% | 2665 |
| chr13 | 204195 | 0.18% | 1082 |
| chr14 | 365674 | 0.34% | 1931 |
| chr15 | 342333 | 0.34% | 1862 |
| chr16 | 444622 | 0.49% | 2349 |
| chr17 | 620890 | 0.75% | 3291 |
| chr18 | 171066 | 0.21% | 922 |
| chr19 | 634919 | 1.08% | 3301 |
| chr20 | 302365 | 0.47% | 1644 |
| chr21 | 144323 | 0.31% | 782 |
| chr22 | 282723 | 0.56% | 1563 |
| chrX | 297056 | 0.19% | 1615 |
| chrY | 10658 | 0.02% | 58 |
| 3342 contigs with no values (129077085 bp) | 0 | 0.00% | 0 |
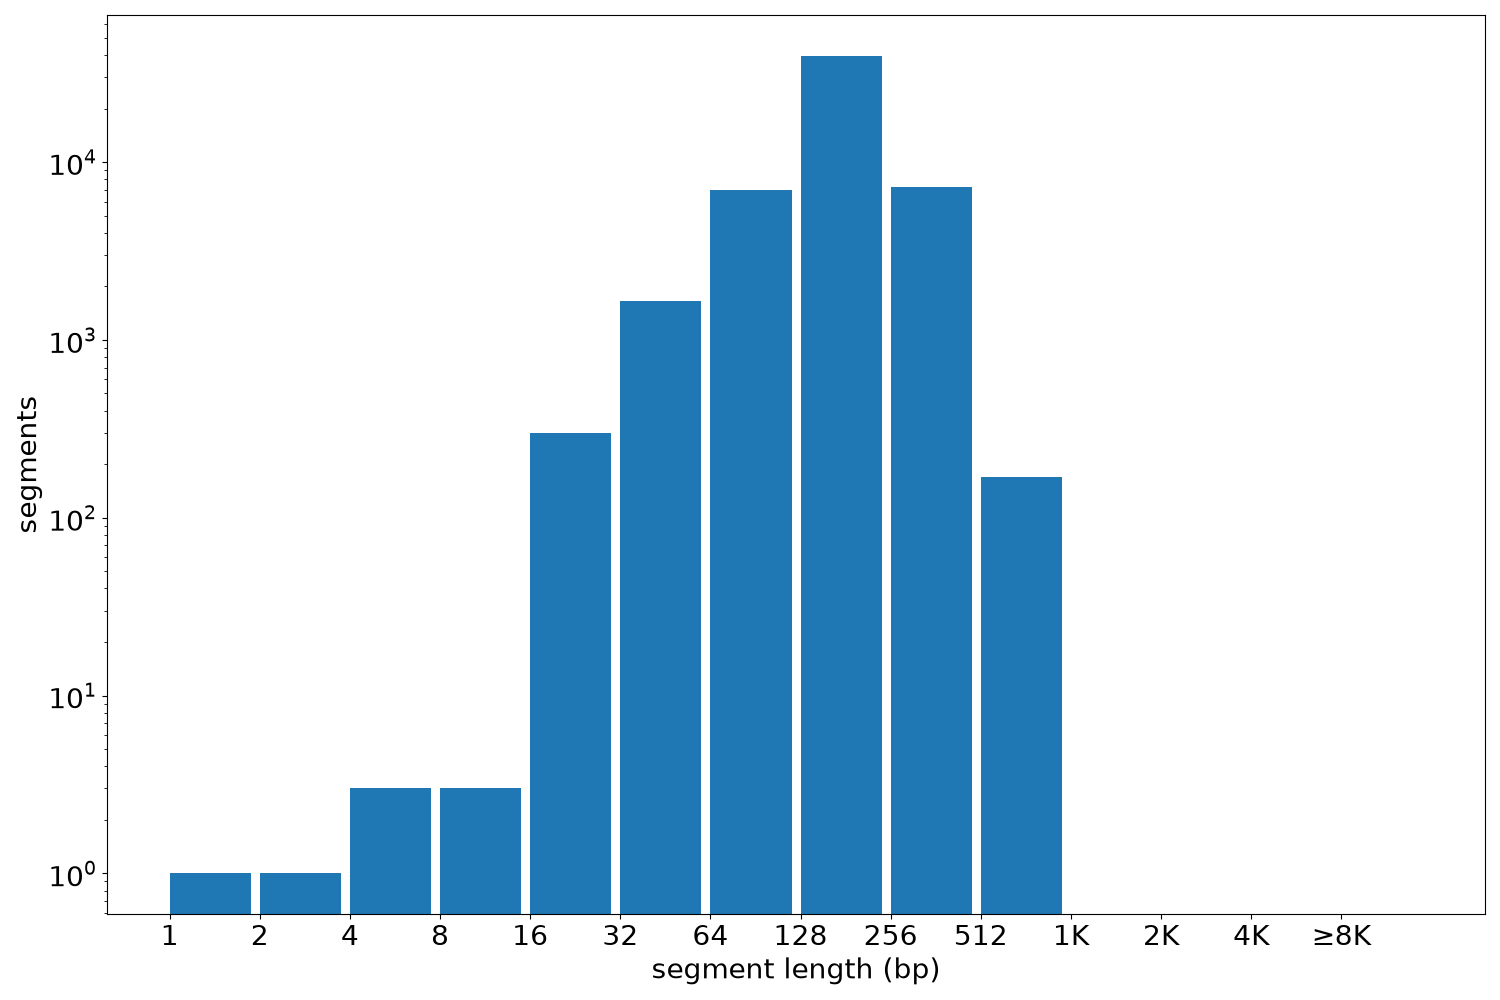
Segment lengths
| segments | min | max | mean | median | |
|---|---|---|---|---|---|
| segments | 55946 | 1 | 820 | 186.82 | 180 |
Files
| Filename | Size | md5 |
|---|---|---|
| ENCFF986UZO.bed.gz | 627.62 KB | 12053b3c9aebe1df0803d39a20122210 |
| ENCFF986UZO.tabix.bed.gz | 573.79 KB | d3cedba33e2f49981ace1d6a477e22ae |
| ENCFF986UZO.tabix.bed.gz.tbi | 230.45 KB | 031173f55d873152466170ad8ea5bd8b |
| genomic_resource.yaml | 2.02 KB | 8165cd31a8e2da94505392fd650a08c1 |
| statistics/ |