Resource
| Id | DNase-seq/ENCSR682ZZT |
|---|---|
| Type | position_score |
| Version | 0 |
| Summary | DNase-seq ENCSR682ZZT [biosample_summary="Homo sapiens head of caudate nucleus tissue female adult (83 years)"] |
| Description |
status: released biological_replicates: Rep 1 summary: female adult (83 years) output_type: peaks audit_warning: Signal Portion of Tags (SPOT) is a measure of enrichment, analogous to the commonly used fraction of reads in peaks metric. ENCODE processed alignment files {ENCFF076BCM|/files/ENCFF076BCM/} processed by DNase-seq ENCODE4 v3.0.0 GRCh38 pipeline ({ENCPL848KLD|/pipelines/ENCPL848KLD/}) for GRCh38 assembly have a SPOT1 score of 0.38. According to ENCODE standards, SPOT1 score of 0.4 or higher is considered a product of high quality data. Any sample with a SPOT1 score <0.3 should be targeted for replacement with a higher quality sample, and a SPOT1 score of 0.25 is considered minimally acceptable SPOT1 score of 0.25 is considered minimally acceptable for rare and hard to find primary tissues. (See {ENCODE DNase-seq data standards|/data-standards/dnase-seq-encode4/}) |
| Labels |
|
Scores (1)
| ID | Type | Default annotation | Description | Histogram | Range | Summary |
|---|---|---|---|---|---|---|
| DNase-seq_ENCSR682ZZT | float |
DNase-seq_ENCSR682ZZT |
DNase-seq ENCSR682ZZT [biosample_summary="Homo sapiens head of caudate nucleus tissue female adult (83 years)"]
|
 |
[0.0645, 24.9] |
|
n counts base pairs; sd is the population standard deviation.
Coverage
| Chromosome | Covered positions | Covered % | Segments |
|---|---|---|---|
| all chromosomes | 22432229 | 0.70% | 114522 |
| chr1 | 2131571 | 0.86% | 10761 |
| chr2 | 1710896 | 0.71% | 8870 |
| chr3 | 1361708 | 0.69% | 6984 |
| chr4 | 987031 | 0.52% | 5037 |
| chr5 | 1162888 | 0.64% | 5981 |
| chr6 | 1233896 | 0.72% | 6246 |
| chr7 | 1145151 | 0.72% | 5940 |
| chr8 | 1017980 | 0.70% | 5237 |
| chr9 | 959700 | 0.69% | 4869 |
| chr10 | 1069632 | 0.80% | 5499 |
| chr11 | 1233012 | 0.91% | 6275 |
| chr12 | 1125523 | 0.84% | 5715 |
| chr13 | 544544 | 0.48% | 2780 |
| chr14 | 738775 | 0.69% | 3786 |
| chr15 | 739135 | 0.72% | 3771 |
| chr16 | 853589 | 0.94% | 4314 |
| chr17 | 1048640 | 1.26% | 5256 |
| chr18 | 463947 | 0.58% | 2456 |
| chr19 | 961719 | 1.64% | 4679 |
| chr20 | 648738 | 1.01% | 3342 |
| chr21 | 245973 | 0.53% | 1287 |
| chr22 | 466225 | 0.92% | 2374 |
| chrX | 581738 | 0.37% | 3061 |
| chrY | 218 | <0.01% | 2 |
| 3342 contigs with no values (129077085 bp) | 0 | 0.00% | 0 |
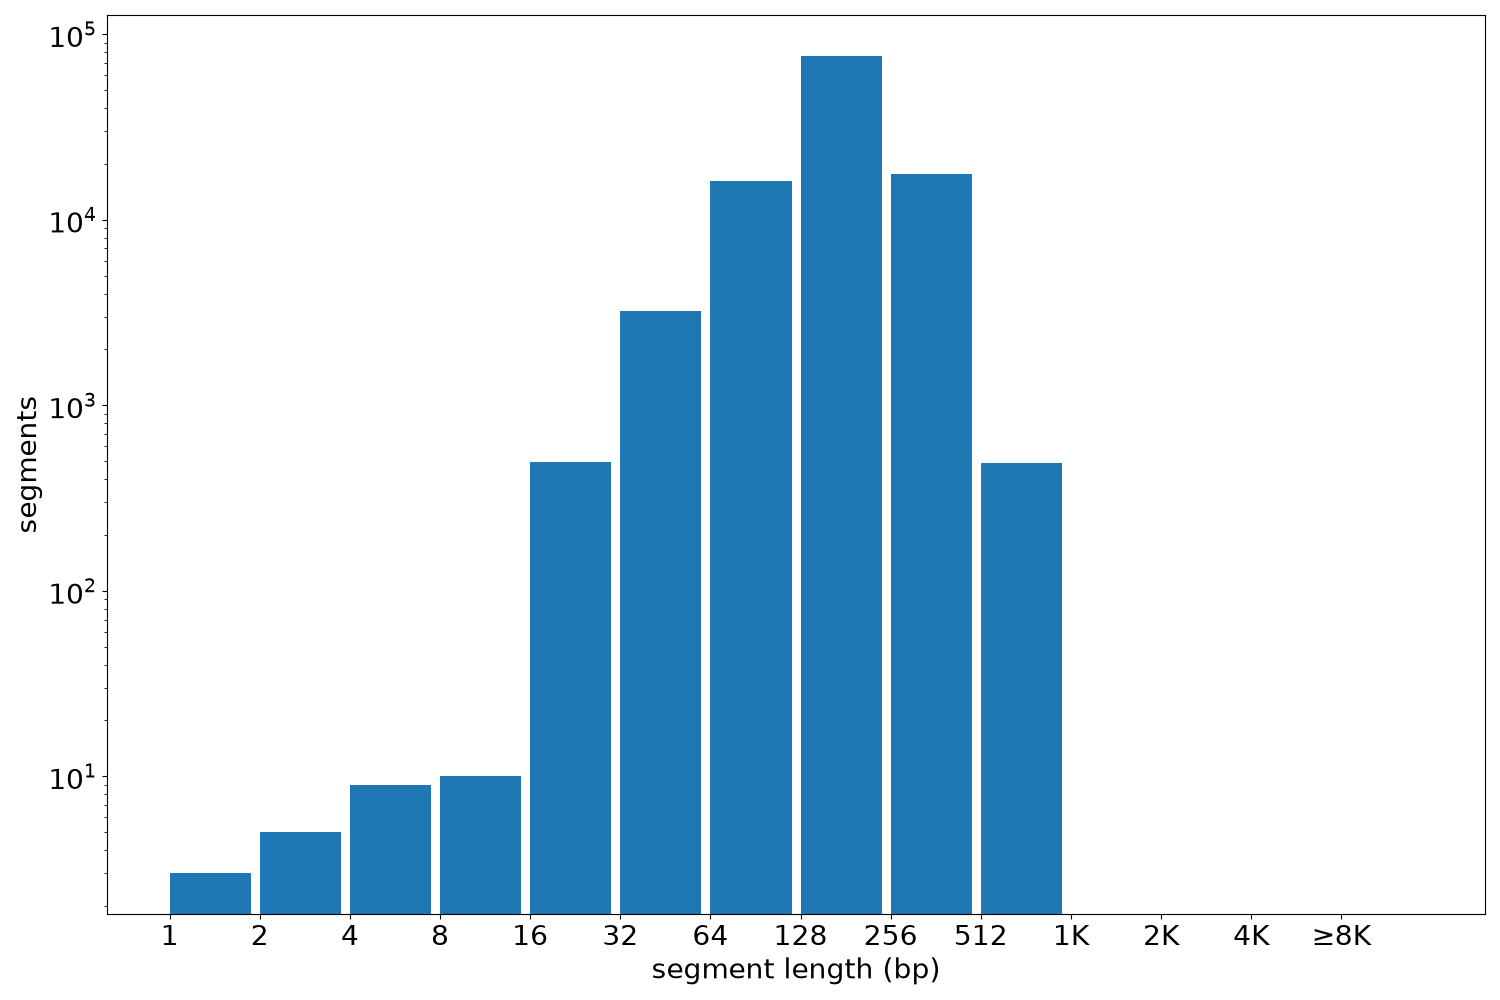
Segment lengths
| segments | min | max | mean | median | |
|---|---|---|---|---|---|
| segments | 114522 | 1 | 960 | 195.88 | 200 |
Files
| Filename | Size | md5 |
|---|---|---|
| ENCFF661CDH.bed.gz | 1.23 MB | 4edb9c813813ad61d5ae2d6f6f946ed9 |
| ENCFF661CDH.tabix.bed.gz | 1.12 MB | b83c4bfcff17288b113505216ead2062 |
| ENCFF661CDH.tabix.bed.gz.tbi | 476.68 KB | faff7caea4cb42b6a02ee49937e38cc9 |
| genomic_resource.yaml | 2.07 KB | 4f0f45a5782d50187d77ed5e8e2abb45 |
| statistics/ |