Resource
| Id | DNase-seq/ENCSR649XRC |
|---|---|
| Type | position_score |
| Version | 0 |
| Summary | DNase-seq ENCSR649XRC [biosample_summary="Homo sapiens CD8-positive, alpha-beta T cell female adult (33 years)"] |
| Description |
status: released biological_replicates: Rep 1 summary: female adult (33 years) output_type: peaks audit_warning: Alignment file {ENCFF282TVE|/files/ENCFF282TVE/} processed by DNase-seq ENCODE4 v3.0.0-alpha.2 GRCh38 pipeline ( {ENCPL848KLD|/pipelines/ENCPL848KLD/} ) for GRCh38 assembly has 24166612 mapped reads. According to ENCODE standards, conventional DNase-seq profile requires a minimum of 20 million uniquely mapped reads to generate a reliable SPOT (Signal Portion of Tags) score. The recommended value is > 50 million. For deep, foot-printing depth DNase-seq 150-200 million uniquely mapped reads are recommended. (See {ENCODE DNase-seq data standards|/data-standards/dnase-seq-encode4/}) audit_warning: Signal Portion of Tags (SPOT) is a measure of enrichment, analogous to the commonly used fraction of reads in peaks metric. ENCODE processed alignment files {ENCFF282TVE|/files/ENCFF282TVE/} processed by DNase-seq ENCODE4 v3.0.0-alpha.2 GRCh38 pipeline ({ENCPL848KLD|/pipelines/ENCPL848KLD/}) for GRCh38 assembly have a SPOT1 score of 0.37. According to ENCODE standards, SPOT1 score of 0.4 or higher is considered a product of high quality data. Any sample with a SPOT1 score <0.3 should be targeted for replacement with a higher quality sample, and a SPOT1 score of 0.25 is considered minimally acceptable SPOT1 score of 0.25 is considered minimally acceptable for rare and hard to find primary tissues. (See {ENCODE DNase-seq data standards|/data-standards/dnase-seq-encode4/}) |
| Labels |
|
Scores (1)
| ID | Type | Default annotation | Description | Histogram | Range | Summary |
|---|---|---|---|---|---|---|
| DNase-seq_ENCSR649XRC | float |
DNase-seq_ENCSR649XRC |
DNase-seq ENCSR649XRC [biosample_summary="Homo sapiens CD8-positive, alpha-beta T cell female adult (33 years)"]
|
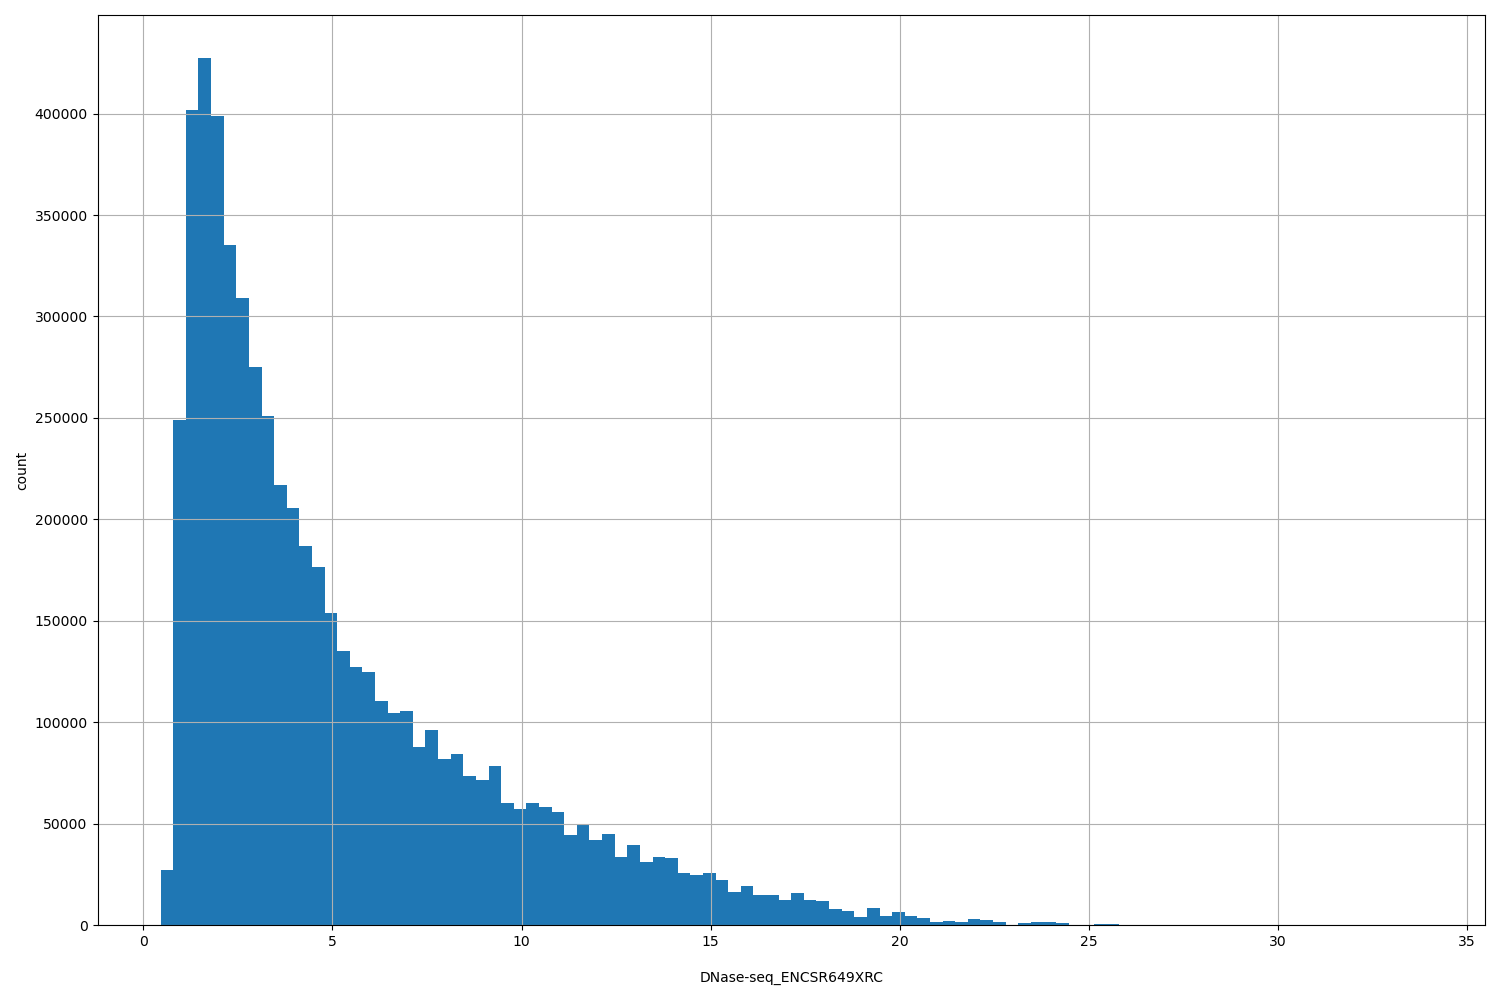 |
[0.457, 33.8] |
|
n counts base pairs; sd is the population standard deviation.
Coverage
| Chromosome | Covered positions | Covered % | Segments |
|---|---|---|---|
| all chromosomes | 5829170 | 0.18% | 32018 |
| chr1 | 604772 | 0.24% | 3322 |
| chr2 | 407470 | 0.17% | 2266 |
| chr3 | 319233 | 0.16% | 1782 |
| chr4 | 204283 | 0.11% | 1101 |
| chr5 | 260825 | 0.14% | 1442 |
| chr6 | 337336 | 0.20% | 1863 |
| chr7 | 272509 | 0.17% | 1504 |
| chr8 | 207529 | 0.14% | 1179 |
| chr9 | 229247 | 0.17% | 1259 |
| chr10 | 247961 | 0.19% | 1375 |
| chr11 | 301012 | 0.22% | 1632 |
| chr12 | 304575 | 0.23% | 1665 |
| chr13 | 115094 | 0.10% | 621 |
| chr14 | 207210 | 0.19% | 1128 |
| chr15 | 190267 | 0.19% | 1061 |
| chr16 | 245720 | 0.27% | 1335 |
| chr17 | 356024 | 0.43% | 1944 |
| chr18 | 84852 | 0.11% | 473 |
| chr19 | 406142 | 0.69% | 2144 |
| chr20 | 155618 | 0.24% | 884 |
| chr21 | 69717 | 0.15% | 391 |
| chr22 | 142419 | 0.28% | 786 |
| chrX | 159355 | 0.10% | 861 |
| 3343 contigs with no values (186304500 bp) | 0 | 0.00% | 0 |
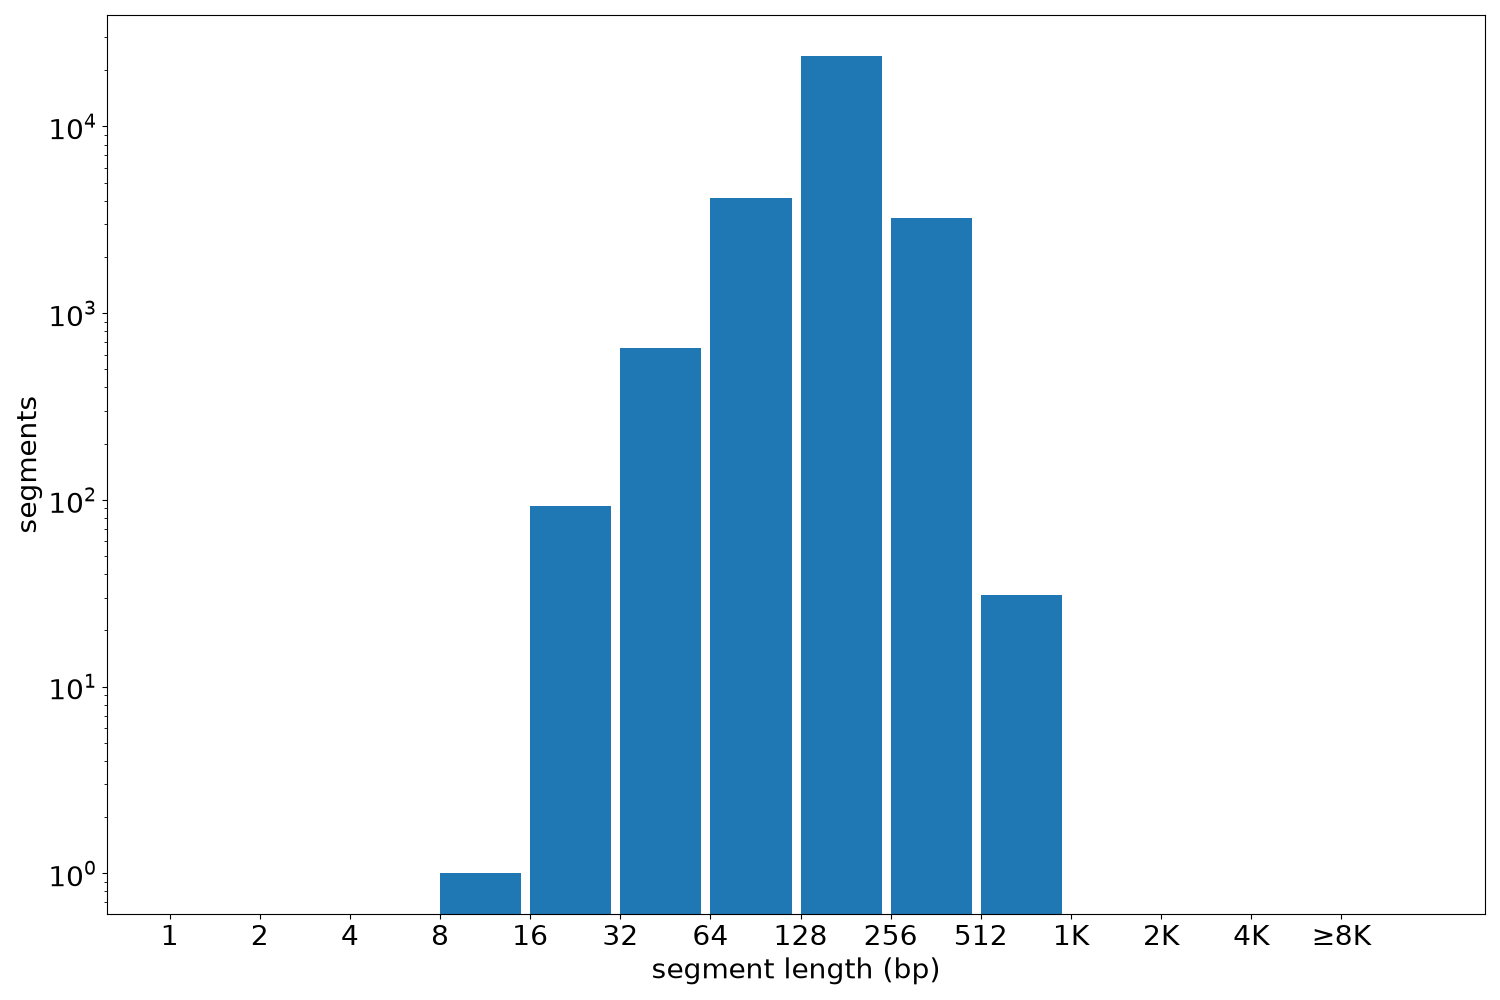
Segment lengths
| segments | min | max | mean | median | |
|---|---|---|---|---|---|
| segments | 32018 | 9 | 700 | 182.06 | 180 |
Files
| Filename | Size | md5 |
|---|---|---|
| ENCFF392UZA.bed.gz | 346.85 KB | ae83beda4857a6e45e26b8bb3e4db71a |
| ENCFF392UZA.tabix.bed.gz | 311.16 KB | c1bbe18148d8495f1177e8b7d561dce0 |
| ENCFF392UZA.tabix.bed.gz.tbi | 185.94 KB | a818b3c51fba687d9f420d0fc7185a73 |
| genomic_resource.yaml | 2.71 KB | b6169da3dec34d296ff2a0432bd1d67a |
| statistics/ |