Resource
| Id | DNase-seq/ENCSR620QNS |
|---|---|
| Type | position_score |
| Version | 0 |
| Summary | DNase-seq ENCSR620QNS [biosample_summary="Homo sapiens HAP-1"] |
| Description |
status: released biological_replicates: Rep 2 summary: output_type: peaks audit_warning: Signal Portion of Tags (SPOT) is a measure of enrichment, analogous to the commonly used fraction of reads in peaks metric. ENCODE processed alignment files {ENCFF427IVB|/files/ENCFF427IVB/} processed by DNase-seq ENCODE4 v3.0.0-alpha.2 GRCh38 pipeline ({ENCPL848KLD|/pipelines/ENCPL848KLD/}) for GRCh38 assembly have a SPOT1 score of 0.31. According to ENCODE standards, SPOT1 score of 0.4 or higher is considered a product of high quality data. Any sample with a SPOT1 score <0.3 should be targeted for replacement with a higher quality sample, and a SPOT1 score of 0.25 is considered minimally acceptable SPOT1 score of 0.25 is considered minimally acceptable for rare and hard to find primary tissues. (See {ENCODE DNase-seq data standards|/data-standards/dnase-seq-encode4/}) audit_warning: Signal Portion of Tags (SPOT) is a measure of enrichment, analogous to the commonly used fraction of reads in peaks metric. ENCODE processed alignment files {ENCFF303JZI|/files/ENCFF303JZI/} processed by DNase-seq ENCODE4 v3.0.0-alpha.2 GRCh38 pipeline ({ENCPL848KLD|/pipelines/ENCPL848KLD/}) for GRCh38 assembly have a SPOT1 score of 0.33. According to ENCODE standards, SPOT1 score of 0.4 or higher is considered a product of high quality data. Any sample with a SPOT1 score <0.3 should be targeted for replacement with a higher quality sample, and a SPOT1 score of 0.25 is considered minimally acceptable SPOT1 score of 0.25 is considered minimally acceptable for rare and hard to find primary tissues. (See {ENCODE DNase-seq data standards|/data-standards/dnase-seq-encode4/}) |
| Labels |
|
Scores (1)
| ID | Type | Default annotation | Description | Histogram | Range | Summary |
|---|---|---|---|---|---|---|
| DNase-seq_ENCSR620QNS | float |
DNase-seq_ENCSR620QNS |
DNase-seq ENCSR620QNS [biosample_summary="Homo sapiens HAP-1"]
|
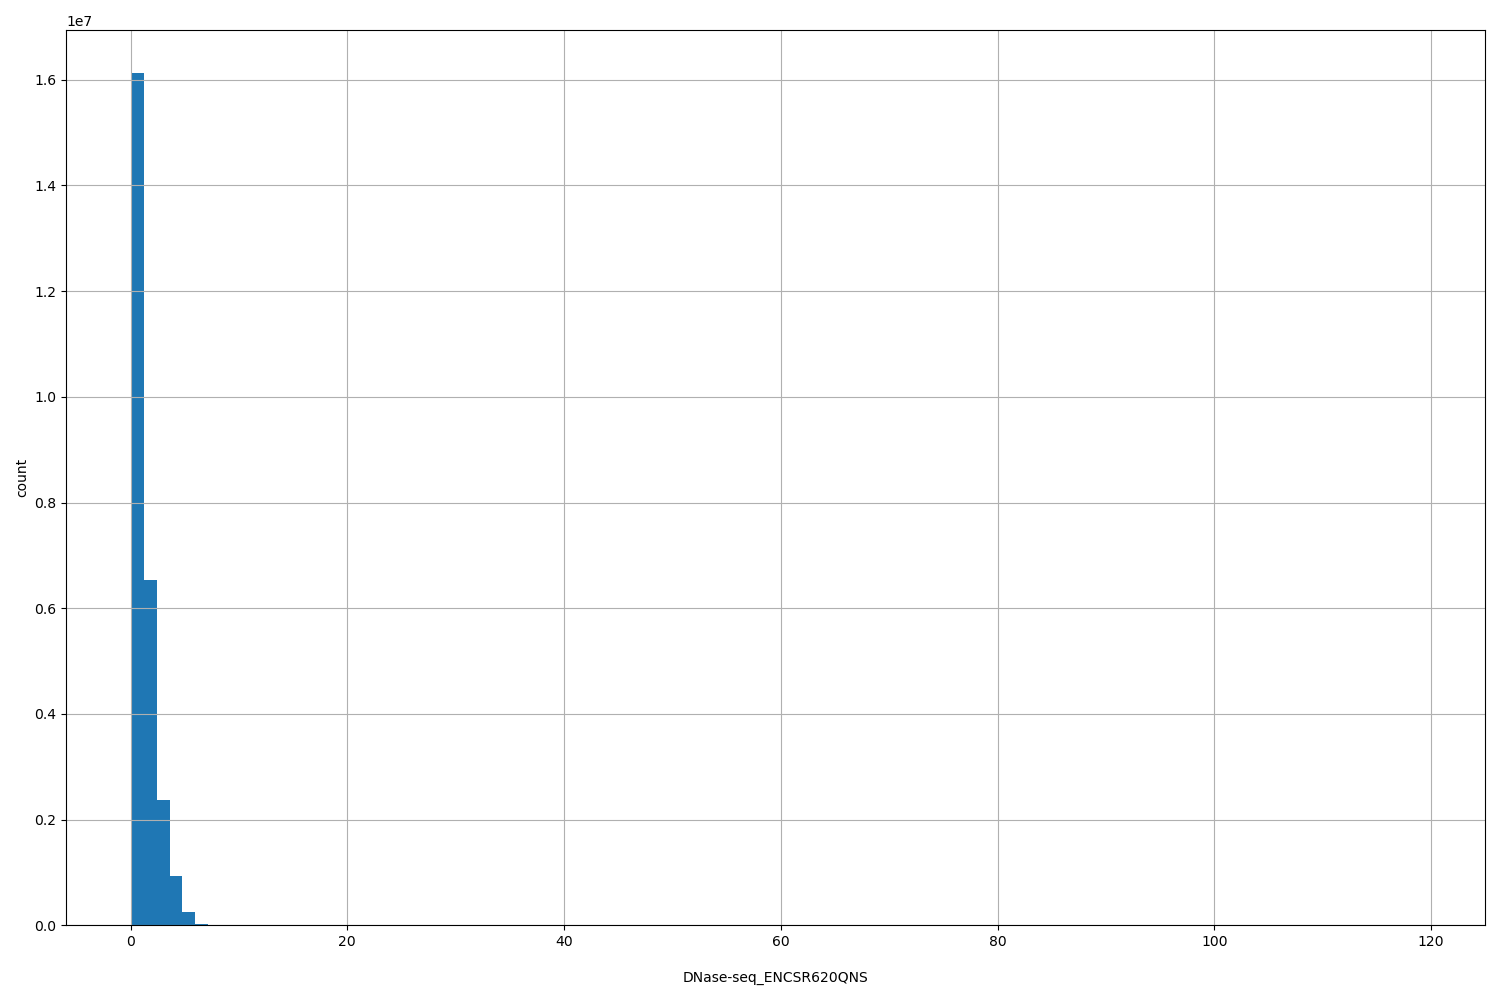 |
[0.0339, 119] |
|
n counts base pairs; sd is the population standard deviation.
Coverage
| Chromosome | Covered positions | Covered % | Segments |
|---|---|---|---|
| all chromosomes | 26279731 | 0.82% | 128885 |
| chr1 | 2270800 | 0.91% | 11271 |
| chr2 | 2144258 | 0.89% | 10451 |
| chr3 | 1974577 | 1.00% | 9606 |
| chr4 | 1706054 | 0.90% | 8177 |
| chr5 | 1489470 | 0.82% | 7257 |
| chr6 | 1718191 | 1.01% | 8299 |
| chr7 | 1395541 | 0.88% | 6745 |
| chr8 | 1175957 | 0.81% | 5738 |
| chr9 | 1065671 | 0.77% | 5268 |
| chr10 | 1114817 | 0.83% | 5517 |
| chr11 | 1164152 | 0.86% | 5796 |
| chr12 | 1321386 | 0.99% | 6485 |
| chr13 | 829778 | 0.73% | 4024 |
| chr14 | 866989 | 0.81% | 4264 |
| chr15 | 888773 | 0.87% | 4385 |
| chr16 | 670446 | 0.74% | 3379 |
| chr17 | 855572 | 1.03% | 4322 |
| chr18 | 626916 | 0.78% | 3073 |
| chr19 | 695178 | 1.19% | 3444 |
| chr20 | 509172 | 0.79% | 2589 |
| chr21 | 225118 | 0.48% | 1122 |
| chr22 | 341392 | 0.67% | 1780 |
| chrX | 1226251 | 0.79% | 5865 |
| chrY | 3272 | 0.01% | 28 |
| 3342 contigs with no values (129077085 bp) | 0 | 0.00% | 0 |
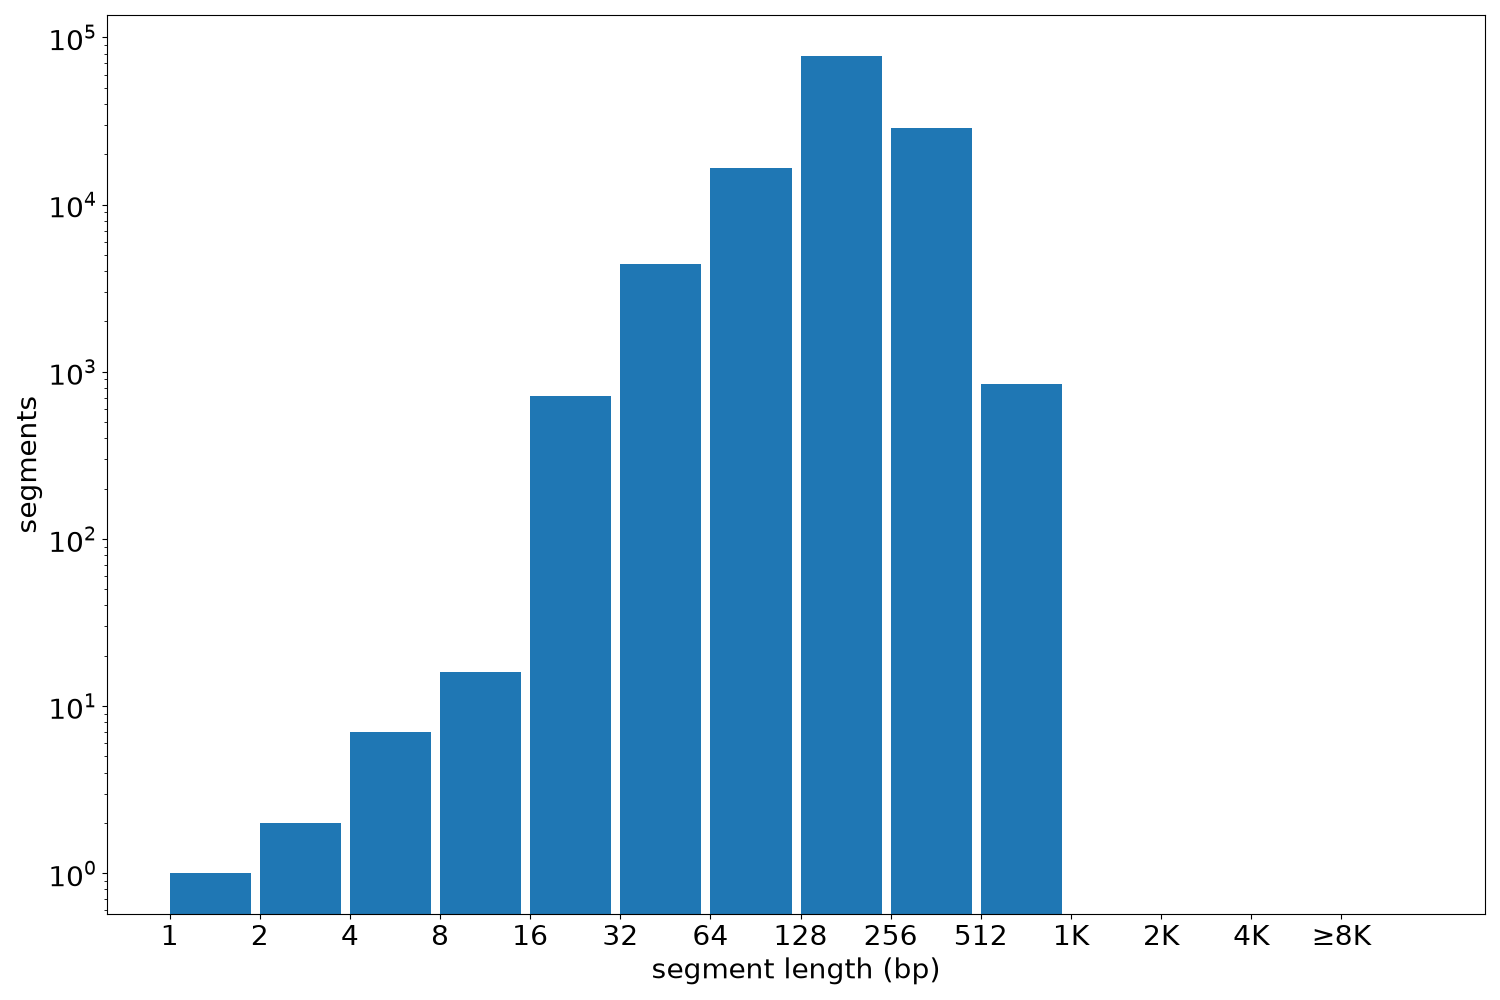
Segment lengths
| segments | min | max | mean | median | |
|---|---|---|---|---|---|
| segments | 128885 | 1 | 900 | 203.9 | 200 |
Files
| Filename | Size | md5 |
|---|---|---|
| ENCFF933LZV.bed.gz | 1.37 MB | ee3154be9d2c4a4618b165ab79e3ddf7 |
| ENCFF933LZV.tabix.bed.gz | 1.26 MB | e3f8872b0962c93ec31353f773a92ae5 |
| ENCFF933LZV.tabix.bed.gz.tbi | 511.61 KB | 516b5f0153a8c5a9067c3928cdb579c9 |
| genomic_resource.yaml | 2.76 KB | d0e070afb63f82dc28b0b5fd663ef66c |
| statistics/ |