Resource
| Id | DNase-seq/ENCSR616AEG |
|---|---|
| Type | position_score |
| Version | 0 |
| Summary | DNase-seq ENCSR616AEG [biosample_summary="Homo sapiens stimulated activated CD4-positive, alpha-beta T cell female adult (33 years) treated with anti-CD3 and anti-CD28 coated beads for 48 hours, 100 ng/mL Interleukin-12 subunit alpha for 48 hours, 100 ng/mL Interleukin-12 subunit beta for 48 hours"] |
| Description |
status: released biological_replicates: Rep 1 summary: female adult (33 years) treated with anti-CD3 and anti-CD28 coated beads for 48 hours, 100 ng/mL Interleukin-12 subunit alpha for 48 hours, 100 ng/mL Interleukin-12 subunit beta for 48 hours output_type: peaks audit_warning: Signal Portion of Tags (SPOT) is a measure of enrichment, analogous to the commonly used fraction of reads in peaks metric. ENCODE processed alignment files {ENCFF563PQP|/files/ENCFF563PQP/} processed by DNase-seq ENCODE4 v3.0.0-alpha.2 GRCh38 pipeline ({ENCPL848KLD|/pipelines/ENCPL848KLD/}) for GRCh38 assembly have a SPOT1 score of 0.38. According to ENCODE standards, SPOT1 score of 0.4 or higher is considered a product of high quality data. Any sample with a SPOT1 score <0.3 should be targeted for replacement with a higher quality sample, and a SPOT1 score of 0.25 is considered minimally acceptable SPOT1 score of 0.25 is considered minimally acceptable for rare and hard to find primary tissues. (See {ENCODE DNase-seq data standards|/data-standards/dnase-seq-encode4/}) |
| Labels |
|
Scores (1)
| ID | Type | Default annotation | Description | Histogram | Range | Summary |
|---|---|---|---|---|---|---|
| DNase-seq_ENCSR616AEG | float |
DNase-seq_ENCSR616AEG |
DNase-seq ENCSR616AEG [biosample_summary="Homo sapiens stimulated activated CD4-positive, alpha-beta T cell female adult (33 years) treated with anti-CD3 and anti-CD28 coated beads for 48 hours, 100 ng/mL Interleukin-12 subunit alpha for 48 hours, 100 ng/mL Interleukin-12 subunit beta for 48 hours"]
|
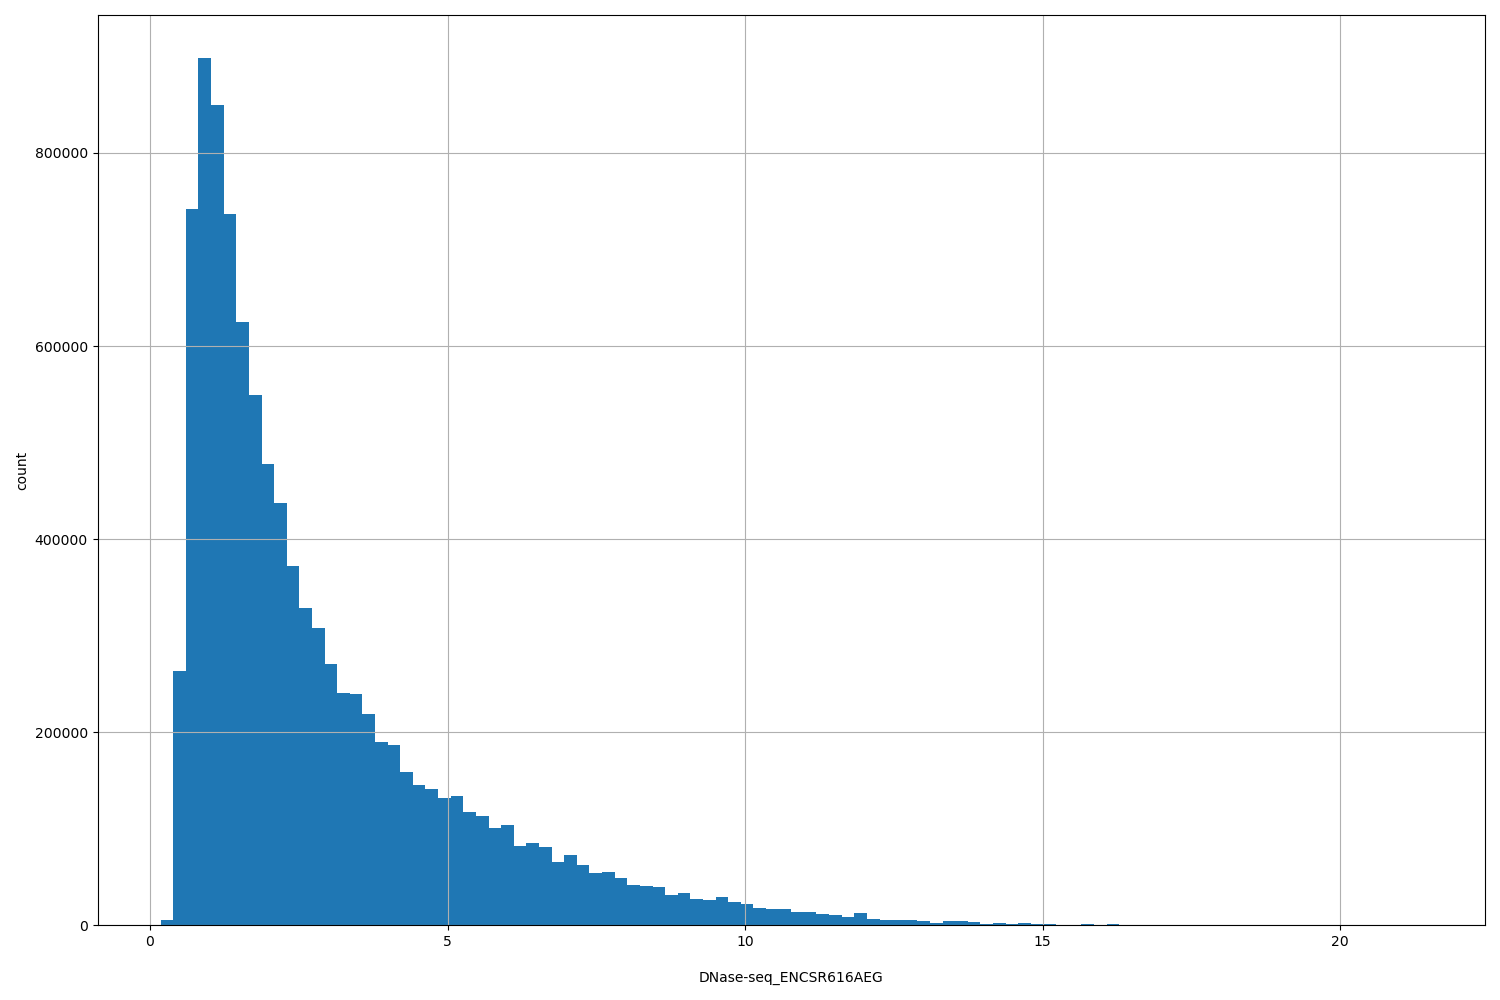 |
[0.178, 21.4] |
|
n counts base pairs; sd is the population standard deviation.
Coverage
| Chromosome | Covered positions | Covered % | Segments |
|---|---|---|---|
| all chromosomes | 10197599 | 0.32% | 53535 |
| chr1 | 1030083 | 0.41% | 5339 |
| chr2 | 720769 | 0.30% | 3864 |
| chr3 | 602480 | 0.30% | 3209 |
| chr4 | 377113 | 0.20% | 1995 |
| chr5 | 473695 | 0.26% | 2520 |
| chr6 | 617156 | 0.36% | 3188 |
| chr7 | 482419 | 0.30% | 2546 |
| chr8 | 396430 | 0.27% | 2134 |
| chr9 | 425690 | 0.31% | 2233 |
| chr10 | 460510 | 0.34% | 2417 |
| chr11 | 511495 | 0.38% | 2692 |
| chr12 | 532018 | 0.40% | 2775 |
| chr13 | 222100 | 0.19% | 1158 |
| chr14 | 341122 | 0.32% | 1788 |
| chr15 | 334069 | 0.33% | 1785 |
| chr16 | 403469 | 0.45% | 2087 |
| chr17 | 551261 | 0.66% | 2850 |
| chr18 | 171597 | 0.21% | 924 |
| chr19 | 614791 | 1.05% | 3096 |
| chr20 | 276002 | 0.43% | 1481 |
| chr21 | 117940 | 0.25% | 622 |
| chr22 | 234643 | 0.46% | 1204 |
| chrX | 300747 | 0.19% | 1628 |
| 3343 contigs with no values (186304500 bp) | 0 | 0.00% | 0 |
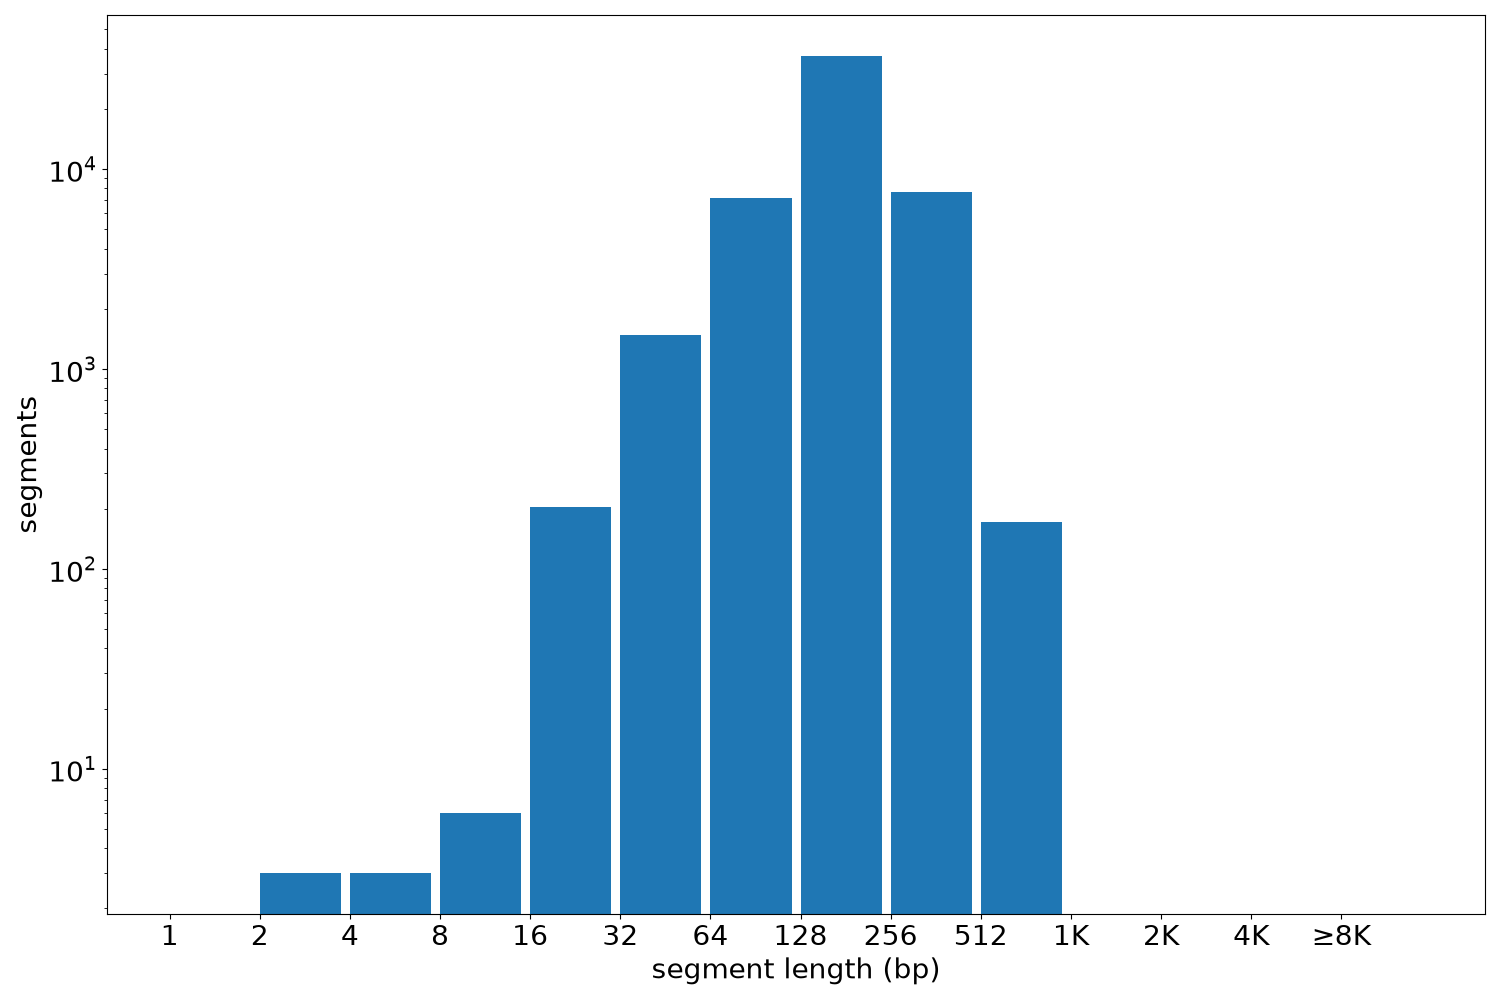
Segment lengths
| segments | min | max | mean | median | |
|---|---|---|---|---|---|
| segments | 53535 | 2 | 740 | 190.48 | 180 |
Files
| Filename | Size | md5 |
|---|---|---|
| ENCFF882JWI.bed.gz | 582.33 KB | 107b08b486ff66d9d74c76d270b0b5f2 |
| ENCFF882JWI.tabix.bed.gz | 526.71 KB | 5c765f69404a0574b2d63469b85543bf |
| ENCFF882JWI.tabix.bed.gz.tbi | 270.24 KB | 7355abb584180357ab3ac1c8f3fe2498 |
| genomic_resource.yaml | 3.0 KB | 723cdb2114bffb0d99c091ae71ee3697 |
| statistics/ |