Resource
| Id | DNase-seq/ENCSR552RKI |
|---|---|
| Type | position_score |
| Version | 0 |
| Summary | DNase-seq ENCSR552RKI [biosample_summary="Homo sapiens placenta tissue embryo (102 days)"] |
| Description |
status: released biological_replicates: Rep 1 summary: embryo (102 days) output_type: peaks audit_warning: Signal Portion of Tags (SPOT) is a measure of enrichment, analogous to the commonly used fraction of reads in peaks metric. ENCODE processed alignment files {ENCFF446RVL|/files/ENCFF446RVL/} processed by DNase-seq ENCODE4 v3.0.0-alpha.2 GRCh38 pipeline ({ENCPL848KLD|/pipelines/ENCPL848KLD/}) for GRCh38 assembly have a SPOT1 score of 0.34. According to ENCODE standards, SPOT1 score of 0.4 or higher is considered a product of high quality data. Any sample with a SPOT1 score <0.3 should be targeted for replacement with a higher quality sample, and a SPOT1 score of 0.25 is considered minimally acceptable SPOT1 score of 0.25 is considered minimally acceptable for rare and hard to find primary tissues. (See {ENCODE DNase-seq data standards|/data-standards/dnase-seq-encode4/}) |
| Labels |
|
Scores (1)
| ID | Type | Default annotation | Description | Histogram | Range | Summary |
|---|---|---|---|---|---|---|
| DNase-seq_ENCSR552RKI | float |
DNase-seq_ENCSR552RKI |
DNase-seq ENCSR552RKI [biosample_summary="Homo sapiens placenta tissue embryo (102 days)"]
|
 |
[0.0295, 12.2] |
|
n counts base pairs; sd is the population standard deviation.
Coverage
| Chromosome | Covered positions | Covered % | Segments |
|---|---|---|---|
| all chromosomes | 22822382 | 0.71% | 114344 |
| chr1 | 2113025 | 0.85% | 10532 |
| chr2 | 1900766 | 0.78% | 9518 |
| chr3 | 1362717 | 0.69% | 6844 |
| chr4 | 791080 | 0.42% | 3990 |
| chr5 | 1093081 | 0.60% | 5496 |
| chr6 | 1231734 | 0.72% | 6143 |
| chr7 | 1095608 | 0.69% | 5548 |
| chr8 | 1001892 | 0.69% | 5046 |
| chr9 | 1015507 | 0.73% | 5099 |
| chr10 | 1323188 | 0.99% | 6694 |
| chr11 | 1338367 | 0.99% | 6669 |
| chr12 | 953143 | 0.72% | 4757 |
| chr13 | 434731 | 0.38% | 2185 |
| chr14 | 847925 | 0.79% | 4143 |
| chr15 | 887333 | 0.87% | 4412 |
| chr16 | 801775 | 0.89% | 4001 |
| chr17 | 1016799 | 1.22% | 5083 |
| chr18 | 512564 | 0.64% | 2604 |
| chr19 | 958668 | 1.64% | 4678 |
| chr20 | 751710 | 1.17% | 3843 |
| chr21 | 349388 | 0.75% | 1780 |
| chr22 | 571884 | 1.13% | 2855 |
| chrX | 443526 | 0.28% | 2278 |
| chrY | 25971 | 0.05% | 146 |
| 3342 contigs with no values (129077085 bp) | 0 | 0.00% | 0 |
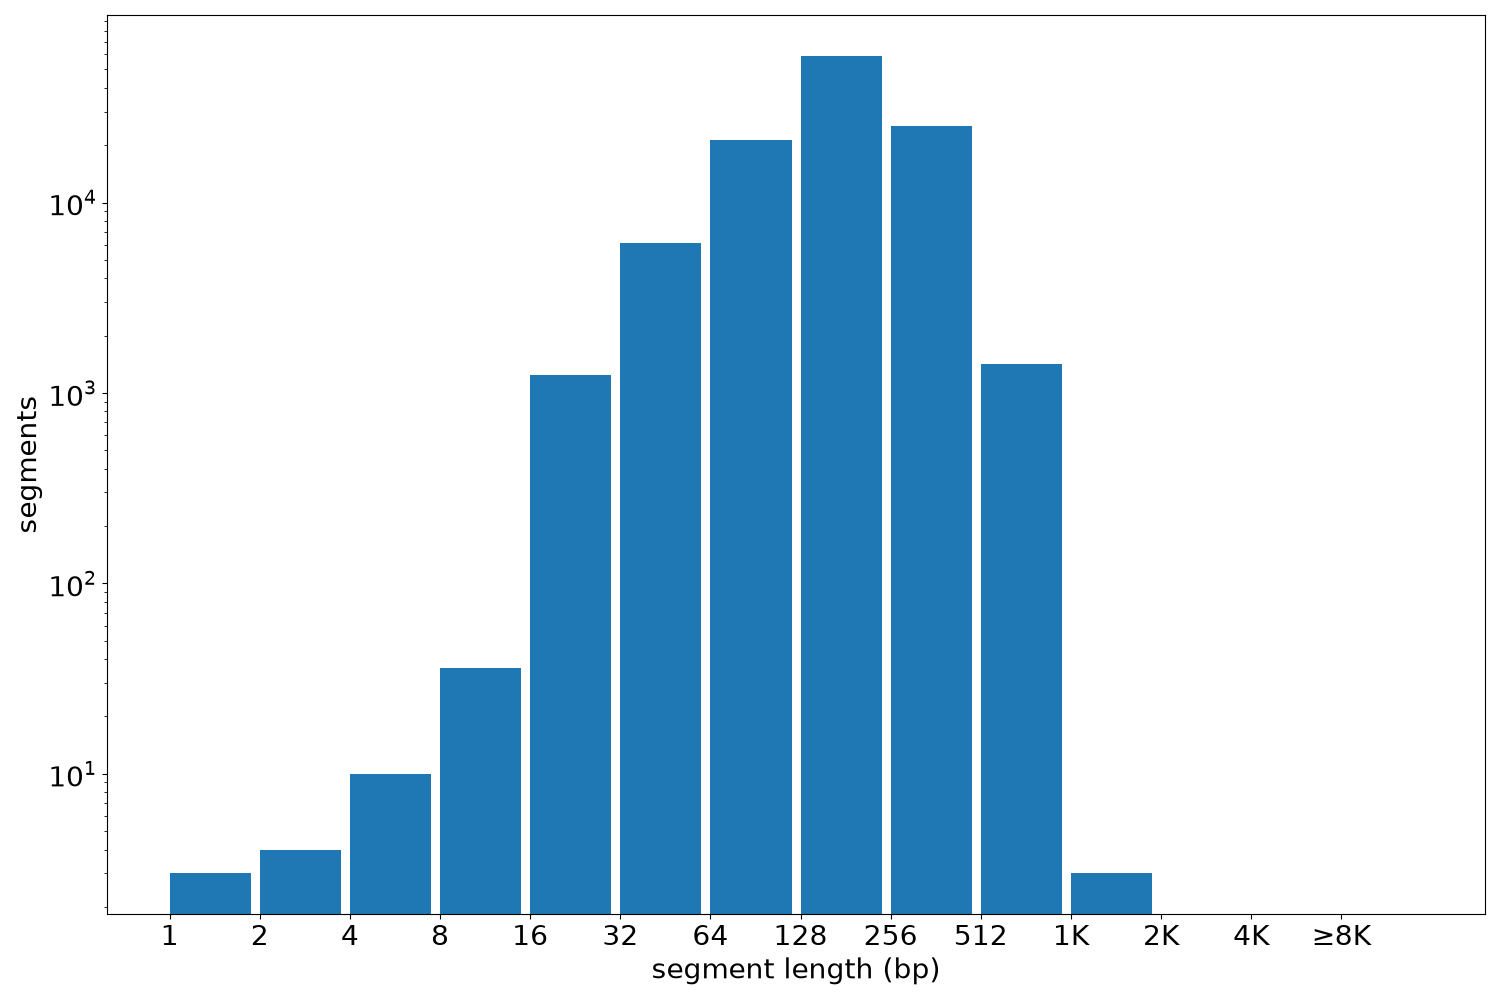
Segment lengths
| segments | min | max | mean | median | |
|---|---|---|---|---|---|
| segments | 114344 | 1 | 1120 | 199.59 | 199 |
Files
| Filename | Size | md5 |
|---|---|---|
| ENCFF734VSF.bed.gz | 1.19 MB | 721aae4ffe7d1e25dc2feef08ff47a22 |
| ENCFF734VSF.tabix.bed.gz | 1.09 MB | 69805e603077d922b2624251cd20e966 |
| ENCFF734VSF.tabix.bed.gz.tbi | 355.6 KB | fe4a4d4d98ded577f25e7b8672b77438 |
| genomic_resource.yaml | 2.0 KB | 8bc0b3226283f791370bed1b2e3fc4fc |
| statistics/ |