Resource
| Id | DNase-seq/ENCSR549NRK |
|---|---|
| Type | position_score |
| Version | 0 |
| Summary | DNase-seq ENCSR549NRK [biosample_summary="Homo sapiens thyroid gland tissue male adult (54 years)"] |
| Description |
status: released biological_replicates: Rep 1 summary: male adult (54 years) output_type: peaks audit_internal_action: Archived analysis {ENCAN895HNZ|/analyses/ENCAN895HNZ/} has in progress subobject quality standard {encode3-dnase|/quality-standards/encode3-dnase/} audit_warning: Alignment file {ENCFF400UAQ|/files/ENCFF400UAQ/} processed by DNase-seq ENCODE3 GRCh38 pipeline ( {ENCPL202DNS|/pipelines/ENCPL202DNS/} ) for GRCh38 assembly has 45525692 mapped reads. According to ENCODE standards, conventional DNase-seq profile requires a minimum of 20 million uniquely mapped reads to generate a reliable SPOT (Signal Portion of Tags) score. The recommended value is > 50 million. For deep, foot-printing depth DNase-seq 150-200 million uniquely mapped reads are recommended. (See {ENCODE DNase-seq data standards|/data-standards/dnase-seq/}) |
| Labels |
|
Scores (1)
| ID | Type | Default annotation | Description | Histogram | Range | Summary |
|---|---|---|---|---|---|---|
| DNase-seq_ENCSR549NRK | float |
DNase-seq_ENCSR549NRK |
DNase-seq ENCSR549NRK [biosample_summary="Homo sapiens thyroid gland tissue male adult (54 years)"]
|
 |
[6, 2.93e+03] |
|
n counts base pairs; sd is the population standard deviation.
Coverage
| Chromosome | Covered positions | Covered % | Segments |
|---|---|---|---|
| all chromosomes | 17605185 | 0.55% | 117225 |
| chr1 | 1678919 | 0.67% | 11181 |
| chr2 | 1354135 | 0.56% | 9019 |
| chr3 | 1100519 | 0.55% | 7318 |
| chr4 | 794555 | 0.42% | 5287 |
| chr5 | 907392 | 0.50% | 6046 |
| chr6 | 996110 | 0.58% | 6636 |
| chr7 | 855626 | 0.54% | 5693 |
| chr8 | 810455 | 0.56% | 5396 |
| chr9 | 798508 | 0.58% | 5318 |
| chr10 | 869264 | 0.65% | 5790 |
| chr11 | 928343 | 0.69% | 6181 |
| chr12 | 830495 | 0.62% | 5530 |
| chr13 | 407316 | 0.36% | 2713 |
| chr14 | 578234 | 0.54% | 3852 |
| chr15 | 612209 | 0.60% | 4077 |
| chr16 | 650226 | 0.72% | 4330 |
| chr17 | 816980 | 0.98% | 5442 |
| chr18 | 381793 | 0.48% | 2545 |
| chr19 | 648393 | 1.11% | 4312 |
| chr20 | 511632 | 0.79% | 3409 |
| chr21 | 189900 | 0.41% | 1265 |
| chr22 | 397509 | 0.78% | 2647 |
| chrX | 461202 | 0.30% | 3068 |
| chrY | 25470 | 0.04% | 170 |
| 3342 contigs with no values (129077085 bp) | 0 | 0.00% | 0 |
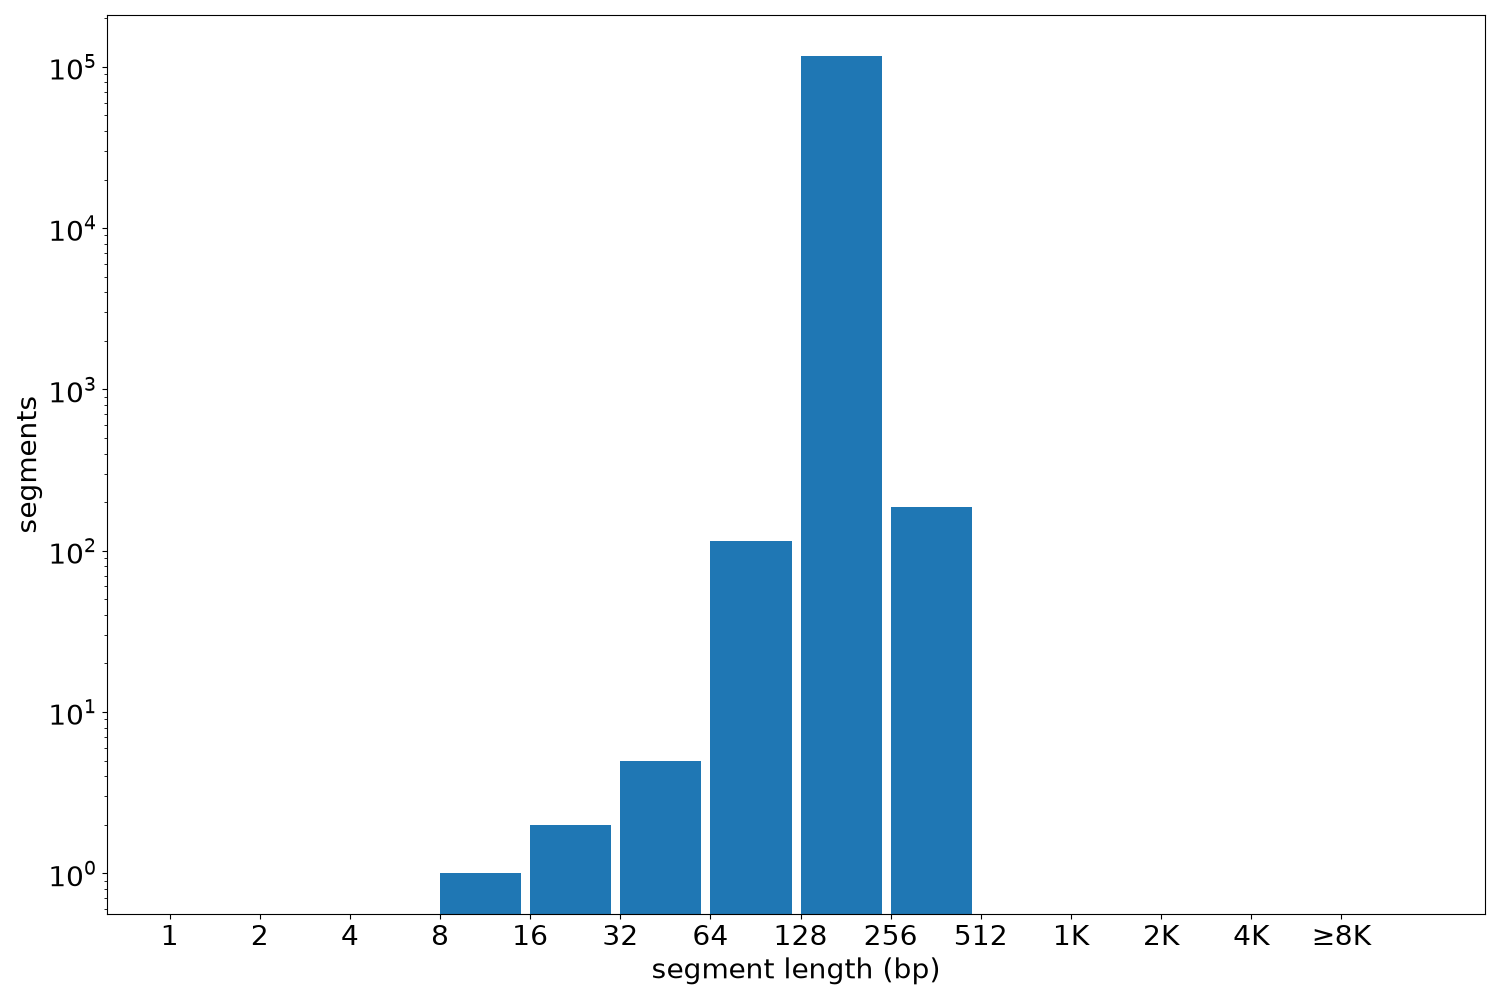
Segment lengths
| segments | min | max | mean | median | |
|---|---|---|---|---|---|
| segments | 117225 | 13 | 450 | 150.18 | 150 |
Files
| Filename | Size | md5 |
|---|---|---|
| ENCFF515ZIO.bed.gz | 1.13 MB | b4f420caf6136fa6942e4d1bcf4399cc |
| ENCFF515ZIO.tabix.bed.gz | 993.92 KB | 09ed1ef2282d2992bd3d511dea70d669 |
| ENCFF515ZIO.tabix.bed.gz.tbi | 466.27 KB | de09302862e4a3c94a7babd30df335fd |
| genomic_resource.yaml | 1.99 KB | ae8eabf8721adbf5191f5fb7af497509 |
| statistics/ |