Resource
| Id | DNase-seq/ENCSR510GRY |
|---|---|
| Type | position_score |
| Version | 0 |
| Summary | DNase-seq ENCSR510GRY [biosample_summary="Homo sapiens posterior cingulate gyrus tissue male adult (83 years)"] |
| Description |
status: released biological_replicates: Rep 1 summary: male adult (83 years) output_type: peaks audit_warning: Signal Portion of Tags (SPOT) is a measure of enrichment, analogous to the commonly used fraction of reads in peaks metric. ENCODE processed alignment files {ENCFF567DIU|/files/ENCFF567DIU/} processed by DNase-seq ENCODE4 v3.0.0 GRCh38 pipeline ({ENCPL848KLD|/pipelines/ENCPL848KLD/}) for GRCh38 assembly have a SPOT1 score of 0.32. According to ENCODE standards, SPOT1 score of 0.4 or higher is considered a product of high quality data. Any sample with a SPOT1 score <0.3 should be targeted for replacement with a higher quality sample, and a SPOT1 score of 0.25 is considered minimally acceptable SPOT1 score of 0.25 is considered minimally acceptable for rare and hard to find primary tissues. (See {ENCODE DNase-seq data standards|/data-standards/dnase-seq-encode4/}) |
| Labels |
|
Scores (1)
| ID | Type | Default annotation | Description | Histogram | Range | Summary |
|---|---|---|---|---|---|---|
| DNase-seq_ENCSR510GRY | float |
DNase-seq_ENCSR510GRY |
DNase-seq ENCSR510GRY [biosample_summary="Homo sapiens posterior cingulate gyrus tissue male adult (83 years)"]
|
 |
[0.088, 12.2] |
|
n counts base pairs; sd is the population standard deviation.
Coverage
| Chromosome | Covered positions | Covered % | Segments |
|---|---|---|---|
| all chromosomes | 7952367 | 0.25% | 42470 |
| chr1 | 762988 | 0.31% | 4082 |
| chr2 | 590821 | 0.24% | 3197 |
| chr3 | 435519 | 0.22% | 2313 |
| chr4 | 302012 | 0.16% | 1585 |
| chr5 | 365759 | 0.20% | 1968 |
| chr6 | 384161 | 0.22% | 2053 |
| chr7 | 387118 | 0.24% | 2073 |
| chr8 | 355037 | 0.24% | 1938 |
| chr9 | 361056 | 0.26% | 1880 |
| chr10 | 394796 | 0.30% | 2125 |
| chr11 | 446308 | 0.33% | 2415 |
| chr12 | 366477 | 0.27% | 1947 |
| chr13 | 152924 | 0.13% | 795 |
| chr14 | 273058 | 0.26% | 1455 |
| chr15 | 246399 | 0.24% | 1326 |
| chr16 | 289249 | 0.32% | 1538 |
| chr17 | 442684 | 0.53% | 2371 |
| chr18 | 146437 | 0.18% | 808 |
| chr19 | 477333 | 0.81% | 2402 |
| chr20 | 238281 | 0.37% | 1283 |
| chr21 | 84346 | 0.18% | 469 |
| chr22 | 252467 | 0.50% | 1396 |
| chrX | 189412 | 0.12% | 1003 |
| chrY | 7725 | 0.01% | 48 |
| 3342 contigs with no values (129077085 bp) | 0 | 0.00% | 0 |
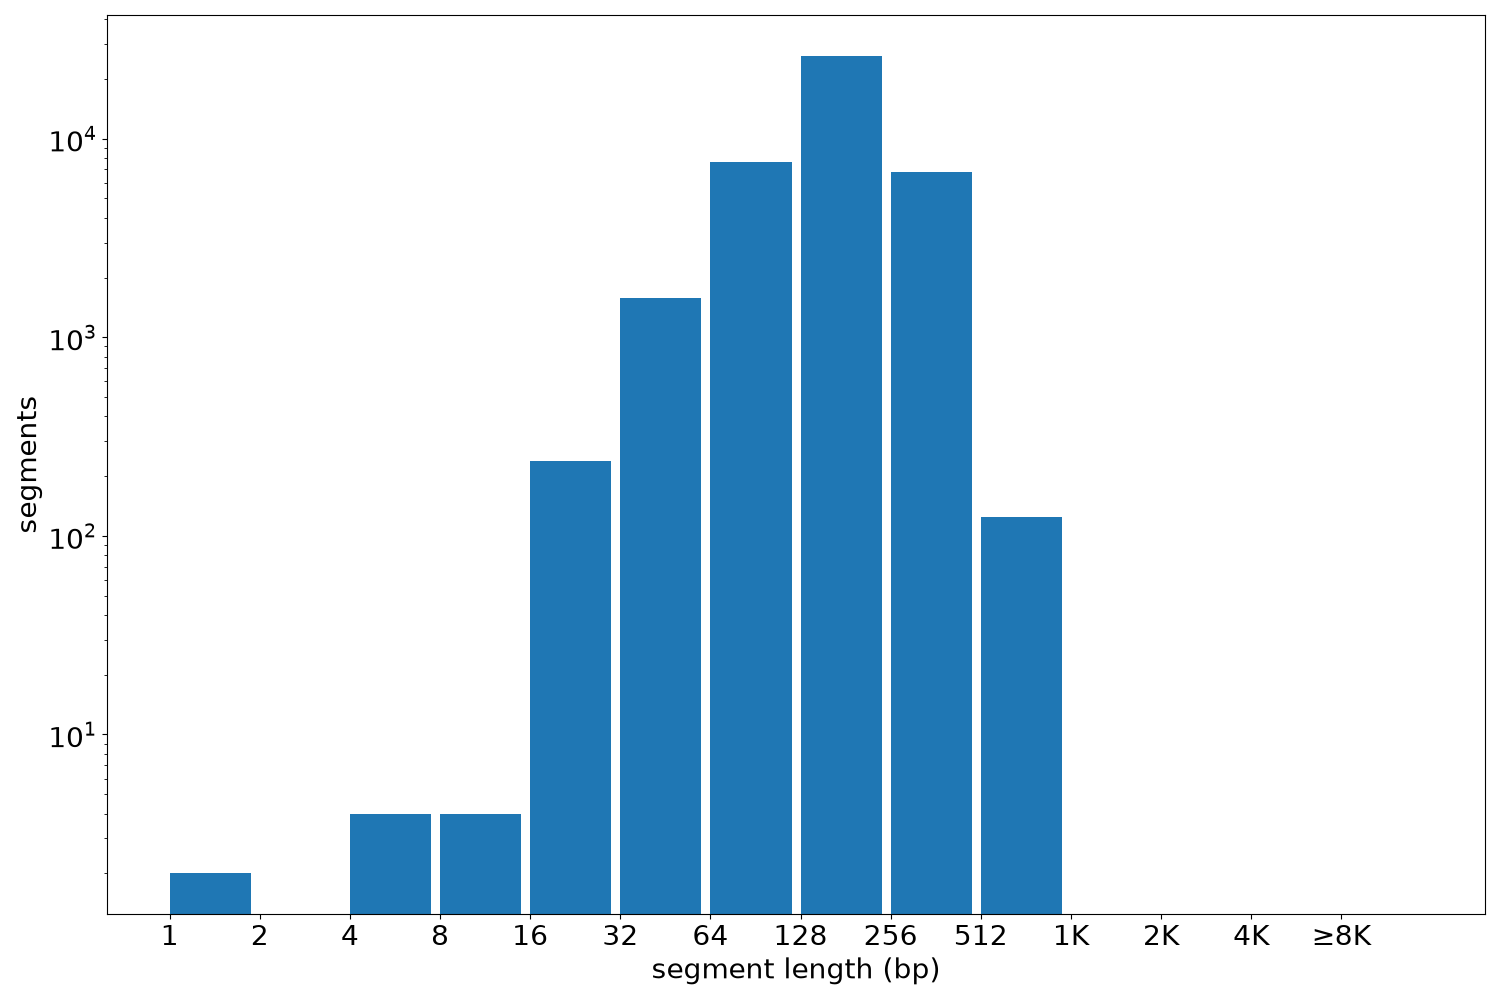
Segment lengths
| segments | min | max | mean | median | |
|---|---|---|---|---|---|
| segments | 42470 | 1 | 940 | 187.25 | 180 |
Files
| Filename | Size | md5 |
|---|---|---|
| ENCFF374LXL.bed.gz | 464.91 KB | 3c41731a4190a1c9b8bd2e08555b1ad7 |
| ENCFF374LXL.tabix.bed.gz | 421.49 KB | 3887b2fc6e72b7024edb889737fe9a51 |
| ENCFF374LXL.tabix.bed.gz.tbi | 205.5 KB | 0ac1b623283a60e7514cc87d152a6b7f |
| genomic_resource.yaml | 2.07 KB | 39a23cb49ce340739310c2d6e1321b4f |
| statistics/ |