Resource
| Id | DNase-seq/ENCSR503HIB |
|---|---|
| Type | position_score |
| Version | 0 |
| Summary | DNase-seq ENCSR503HIB [biosample_summary="Homo sapiens cerebellar cortex tissue male adult (78 years) and male adult (84 years)"] |
| Description |
status: released biological_replicates: Rep 1 summary: male adult (84 years) male adult (78 years) output_type: peaks audit_warning: Signal Portion of Tags (SPOT) is a measure of enrichment, analogous to the commonly used fraction of reads in peaks metric. ENCODE processed alignment files {ENCFF529PQJ|/files/ENCFF529PQJ/} processed by DNase-seq ENCODE4 v3.0.0-alpha.2 GRCh38 pipeline ({ENCPL848KLD|/pipelines/ENCPL848KLD/}) for GRCh38 assembly have a SPOT1 score of 0.36. According to ENCODE standards, SPOT1 score of 0.4 or higher is considered a product of high quality data. Any sample with a SPOT1 score <0.3 should be targeted for replacement with a higher quality sample, and a SPOT1 score of 0.25 is considered minimally acceptable SPOT1 score of 0.25 is considered minimally acceptable for rare and hard to find primary tissues. (See {ENCODE DNase-seq data standards|/data-standards/dnase-seq-encode4/}) |
| Labels |
|
Scores (1)
| ID | Type | Default annotation | Description | Histogram | Range | Summary |
|---|---|---|---|---|---|---|
| DNase-seq_ENCSR503HIB | float |
DNase-seq_ENCSR503HIB |
DNase-seq ENCSR503HIB [biosample_summary="Homo sapiens cerebellar cortex tissue male adult (78 years) and male adult (84 years)"]
|
 |
[0.0304, 26.6] |
|
n counts base pairs; sd is the population standard deviation.
Coverage
| Chromosome | Covered positions | Covered % | Segments |
|---|---|---|---|
| all chromosomes | 34020258 | 1.06% | 156692 |
| chr1 | 3187036 | 1.28% | 14545 |
| chr2 | 2507741 | 1.04% | 11597 |
| chr3 | 2189813 | 1.10% | 10014 |
| chr4 | 1568015 | 0.82% | 7178 |
| chr5 | 1973538 | 1.09% | 8940 |
| chr6 | 1996323 | 1.17% | 9021 |
| chr7 | 1799857 | 1.13% | 8351 |
| chr8 | 1621836 | 1.12% | 7439 |
| chr9 | 1488661 | 1.08% | 6900 |
| chr10 | 1559506 | 1.17% | 7213 |
| chr11 | 1776982 | 1.32% | 8190 |
| chr12 | 1744574 | 1.31% | 7887 |
| chr13 | 896904 | 0.78% | 4055 |
| chr14 | 1093344 | 1.02% | 4990 |
| chr15 | 1130266 | 1.11% | 5240 |
| chr16 | 1090456 | 1.21% | 5171 |
| chr17 | 1549071 | 1.86% | 7232 |
| chr18 | 794075 | 0.99% | 3647 |
| chr19 | 1234091 | 2.11% | 5739 |
| chr20 | 868126 | 1.35% | 4113 |
| chr21 | 347765 | 0.74% | 1607 |
| chr22 | 663768 | 1.31% | 3135 |
| chrX | 880015 | 0.56% | 4212 |
| chrY | 58495 | 0.10% | 276 |
| 3342 contigs with no values (129077085 bp) | 0 | 0.00% | 0 |
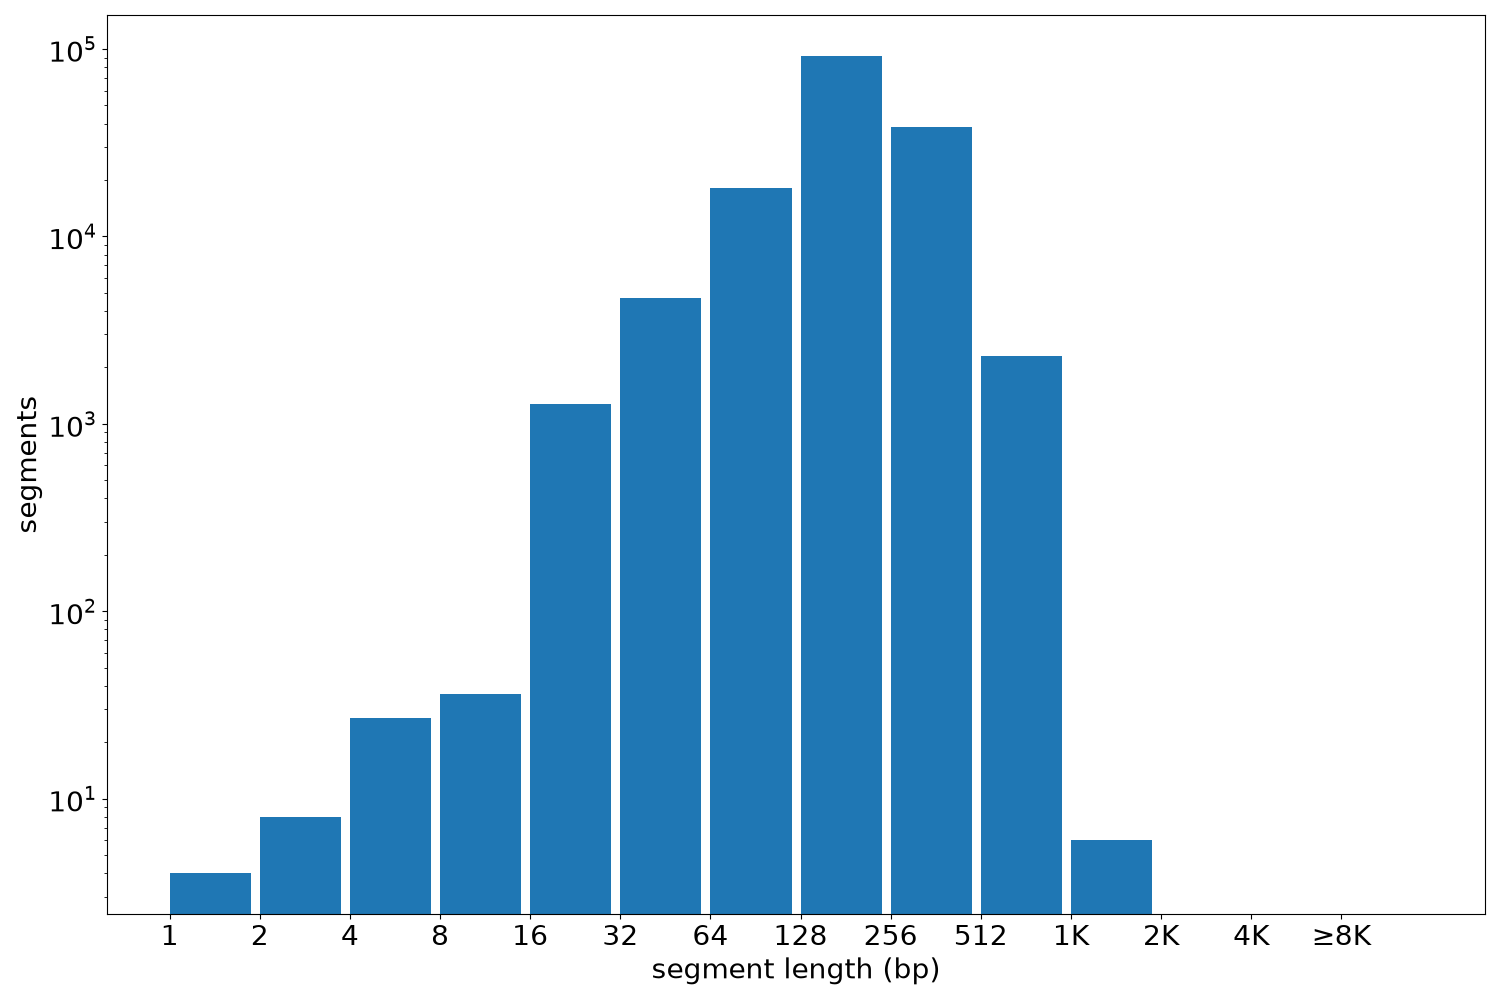
Segment lengths
| segments | min | max | mean | median | |
|---|---|---|---|---|---|
| segments | 156692 | 1 | 1260 | 217.12 | 200 |
Files
| Filename | Size | md5 |
|---|---|---|
| ENCFF219JBP.bed.gz | 1.66 MB | 920acc0cbac1f6b26d127ca3915d8f14 |
| ENCFF219JBP.tabix.bed.gz | 1.54 MB | 620599c9558e581fbce030f58b85e18f |
| ENCFF219JBP.tabix.bed.gz.tbi | 508.25 KB | 53e1d6e055830c48bbe3208a9a3fd059 |
| genomic_resource.yaml | 2.17 KB | ce667dd65922bb3efe5749024f242b33 |
| statistics/ |