Resource
| Id | DNase-seq/ENCSR455GUW |
|---|---|
| Type | position_score |
| Version | 0 |
| Summary | DNase-seq ENCSR455GUW [biosample_summary="Homo sapiens Peyer''s patch tissue male adult (54 years)"] |
| Description |
status: released biological_replicates: Rep 1 summary: male adult (54 years) output_type: peaks audit_warning: Signal Portion of Tags (SPOT) is a measure of enrichment, analogous to the commonly used fraction of reads in peaks metric. ENCODE processed alignment files {ENCFF226LGV|/files/ENCFF226LGV/} processed by DNase-seq ENCODE4 v3.0.0-alpha.2 GRCh38 pipeline ({ENCPL848KLD|/pipelines/ENCPL848KLD/}) for GRCh38 assembly have a SPOT1 score of 0.34. According to ENCODE standards, SPOT1 score of 0.4 or higher is considered a product of high quality data. Any sample with a SPOT1 score <0.3 should be targeted for replacement with a higher quality sample, and a SPOT1 score of 0.25 is considered minimally acceptable SPOT1 score of 0.25 is considered minimally acceptable for rare and hard to find primary tissues. (See {ENCODE DNase-seq data standards|/data-standards/dnase-seq-encode4/}) |
| Labels |
|
Scores (1)
| ID | Type | Default annotation | Description | Histogram | Range | Summary |
|---|---|---|---|---|---|---|
| DNase-seq_ENCSR455GUW | float |
DNase-seq_ENCSR455GUW |
DNase-seq ENCSR455GUW [biosample_summary="Homo sapiens Peyer''s patch tissue male adult (54 years)"]
|
 |
[0.0966, 24.8] |
|
n counts base pairs; sd is the population standard deviation.
Coverage
| Chromosome | Covered positions | Covered % | Segments |
|---|---|---|---|
| all chromosomes | 8389596 | 0.26% | 47721 |
| chr1 | 882700 | 0.35% | 4986 |
| chr2 | 587796 | 0.24% | 3398 |
| chr3 | 464277 | 0.23% | 2685 |
| chr4 | 311025 | 0.16% | 1801 |
| chr5 | 379367 | 0.21% | 2200 |
| chr6 | 467706 | 0.27% | 2672 |
| chr7 | 392637 | 0.25% | 2235 |
| chr8 | 303921 | 0.21% | 1764 |
| chr9 | 360029 | 0.26% | 2047 |
| chr10 | 369773 | 0.28% | 2150 |
| chr11 | 459171 | 0.34% | 2607 |
| chr12 | 404209 | 0.30% | 2287 |
| chr13 | 154827 | 0.14% | 894 |
| chr14 | 273376 | 0.26% | 1554 |
| chr15 | 276627 | 0.27% | 1598 |
| chr16 | 367270 | 0.41% | 2065 |
| chr17 | 502321 | 0.60% | 2794 |
| chr18 | 153541 | 0.19% | 901 |
| chr19 | 528701 | 0.90% | 2818 |
| chr20 | 232555 | 0.36% | 1328 |
| chr21 | 92319 | 0.20% | 523 |
| chr22 | 211279 | 0.42% | 1193 |
| chrX | 205532 | 0.13% | 1176 |
| chrY | 8637 | 0.02% | 45 |
| 3342 contigs with no values (129077085 bp) | 0 | 0.00% | 0 |
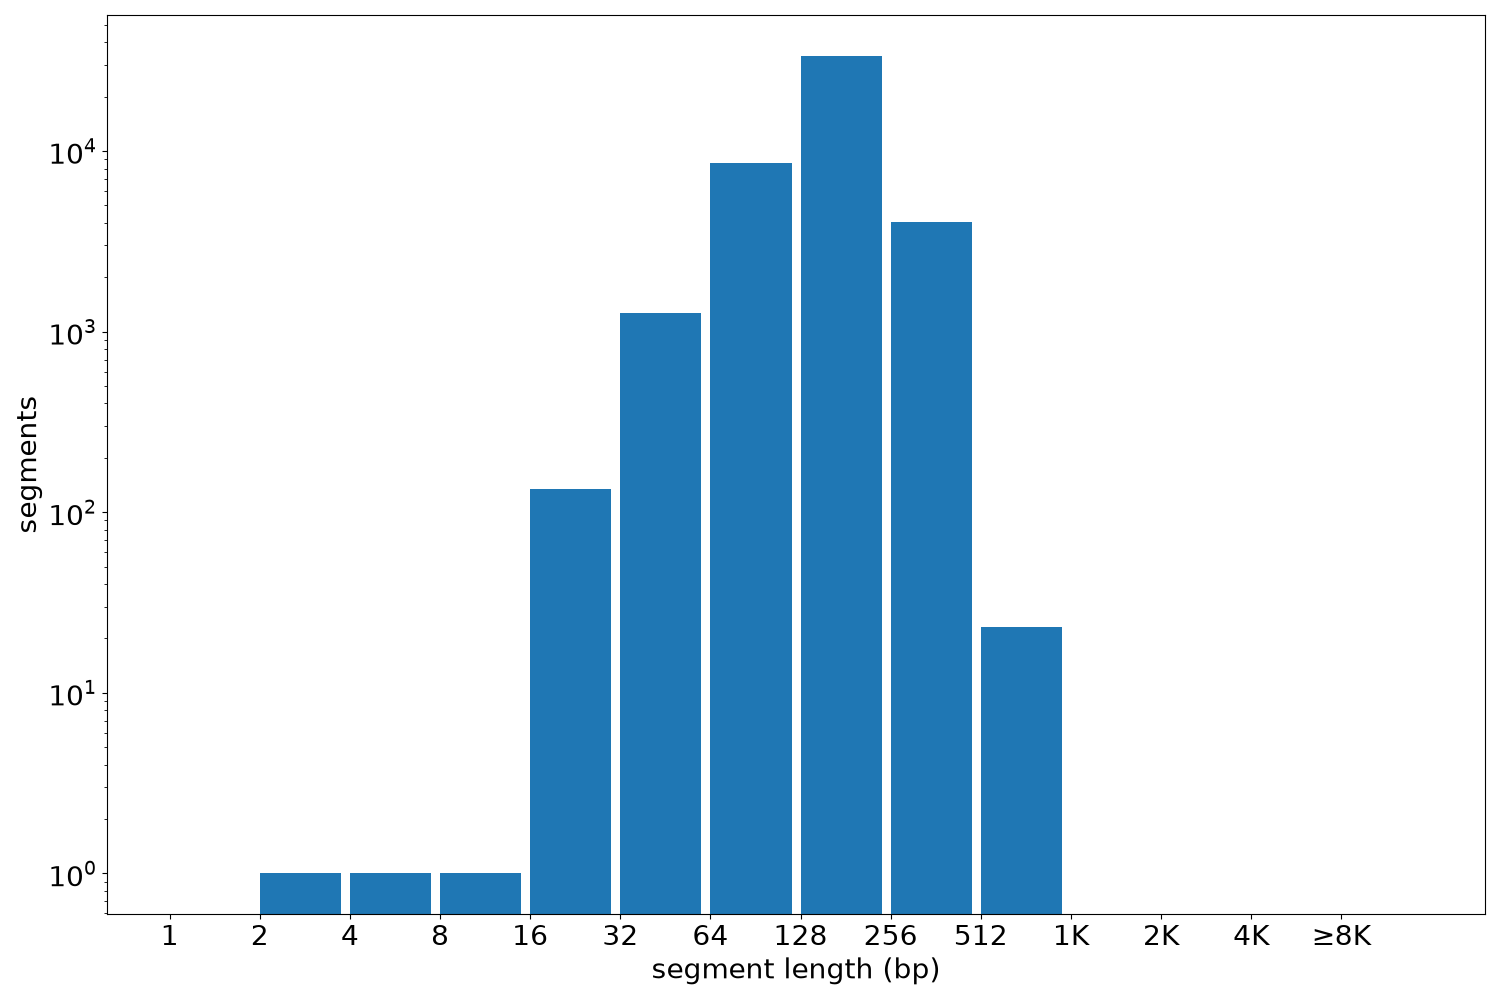
Segment lengths
| segments | min | max | mean | median | |
|---|---|---|---|---|---|
| segments | 47721 | 2 | 640 | 175.81 | 180 |
Files
| Filename | Size | md5 |
|---|---|---|
| ENCFF486OCF.bed.gz | 527.07 KB | abec661b92c010702e938a14d9269f4f |
| ENCFF486OCF.tabix.bed.gz | 475.88 KB | c26e7efec2dc3294c5d4e1694889047a |
| ENCFF486OCF.tabix.bed.gz.tbi | 251.64 KB | 4c239d592f3ad9e82ce41c3debf14969 |
| genomic_resource.yaml | 2.04 KB | 982ac4e2139fbaf6ab8305cc4ec474e0 |
| statistics/ |