Resource
| Id | DNase-seq/ENCSR452RAX |
|---|---|
| Type | position_score |
| Version | 0 |
| Summary | DNase-seq ENCSR452RAX [biosample_summary="Homo sapiens CD4-positive, alpha-beta T cell female adult (37 years) treated with 100 ng/mL Interleukin-6 for 8 hours"] |
| Description |
status: released biological_replicates: Rep 1 summary: female adult (37 years) treated with 100 ng/mL Interleukin-6 for 8 hours output_type: peaks audit_warning: Signal Portion of Tags (SPOT) is a measure of enrichment, analogous to the commonly used fraction of reads in peaks metric. ENCODE processed alignment files {ENCFF021GFS|/files/ENCFF021GFS/} processed by DNase-seq ENCODE4 v3.0.0-alpha.2 GRCh38 pipeline ({ENCPL848KLD|/pipelines/ENCPL848KLD/}) for GRCh38 assembly have a SPOT1 score of 0.39. According to ENCODE standards, SPOT1 score of 0.4 or higher is considered a product of high quality data. Any sample with a SPOT1 score <0.3 should be targeted for replacement with a higher quality sample, and a SPOT1 score of 0.25 is considered minimally acceptable SPOT1 score of 0.25 is considered minimally acceptable for rare and hard to find primary tissues. (See {ENCODE DNase-seq data standards|/data-standards/dnase-seq-encode4/}) |
| Labels |
|
Scores (1)
| ID | Type | Default annotation | Description | Histogram | Range | Summary |
|---|---|---|---|---|---|---|
| DNase-seq_ENCSR452RAX | float |
DNase-seq_ENCSR452RAX |
DNase-seq ENCSR452RAX [biosample_summary="Homo sapiens CD4-positive, alpha-beta T cell female adult (37 years) treated with 100 ng/mL Interleukin-6 for 8 hours"]
|
 |
[0.0409, 53] |
|
n counts base pairs; sd is the population standard deviation.
Coverage
| Chromosome | Covered positions | Covered % | Segments |
|---|---|---|---|
| all chromosomes | 12245805 | 0.38% | 66338 |
| chr1 | 1231072 | 0.49% | 6677 |
| chr2 | 904086 | 0.37% | 4920 |
| chr3 | 690657 | 0.35% | 3755 |
| chr4 | 461466 | 0.24% | 2509 |
| chr5 | 568192 | 0.31% | 3070 |
| chr6 | 740238 | 0.43% | 3972 |
| chr7 | 570502 | 0.36% | 3083 |
| chr8 | 471615 | 0.32% | 2599 |
| chr9 | 480597 | 0.35% | 2613 |
| chr10 | 573711 | 0.43% | 3117 |
| chr11 | 617022 | 0.46% | 3350 |
| chr12 | 638549 | 0.48% | 3457 |
| chr13 | 267260 | 0.23% | 1438 |
| chr14 | 448637 | 0.42% | 2442 |
| chr15 | 397048 | 0.39% | 2167 |
| chr16 | 456766 | 0.51% | 2475 |
| chr17 | 698025 | 0.84% | 3753 |
| chr18 | 199112 | 0.25% | 1087 |
| chr19 | 685546 | 1.17% | 3620 |
| chr20 | 326541 | 0.51% | 1806 |
| chr21 | 149415 | 0.32% | 808 |
| chr22 | 279249 | 0.55% | 1526 |
| chrX | 390038 | 0.25% | 2090 |
| chrY | 461 | <0.01% | 4 |
| 3342 contigs with no values (129077085 bp) | 0 | 0.00% | 0 |
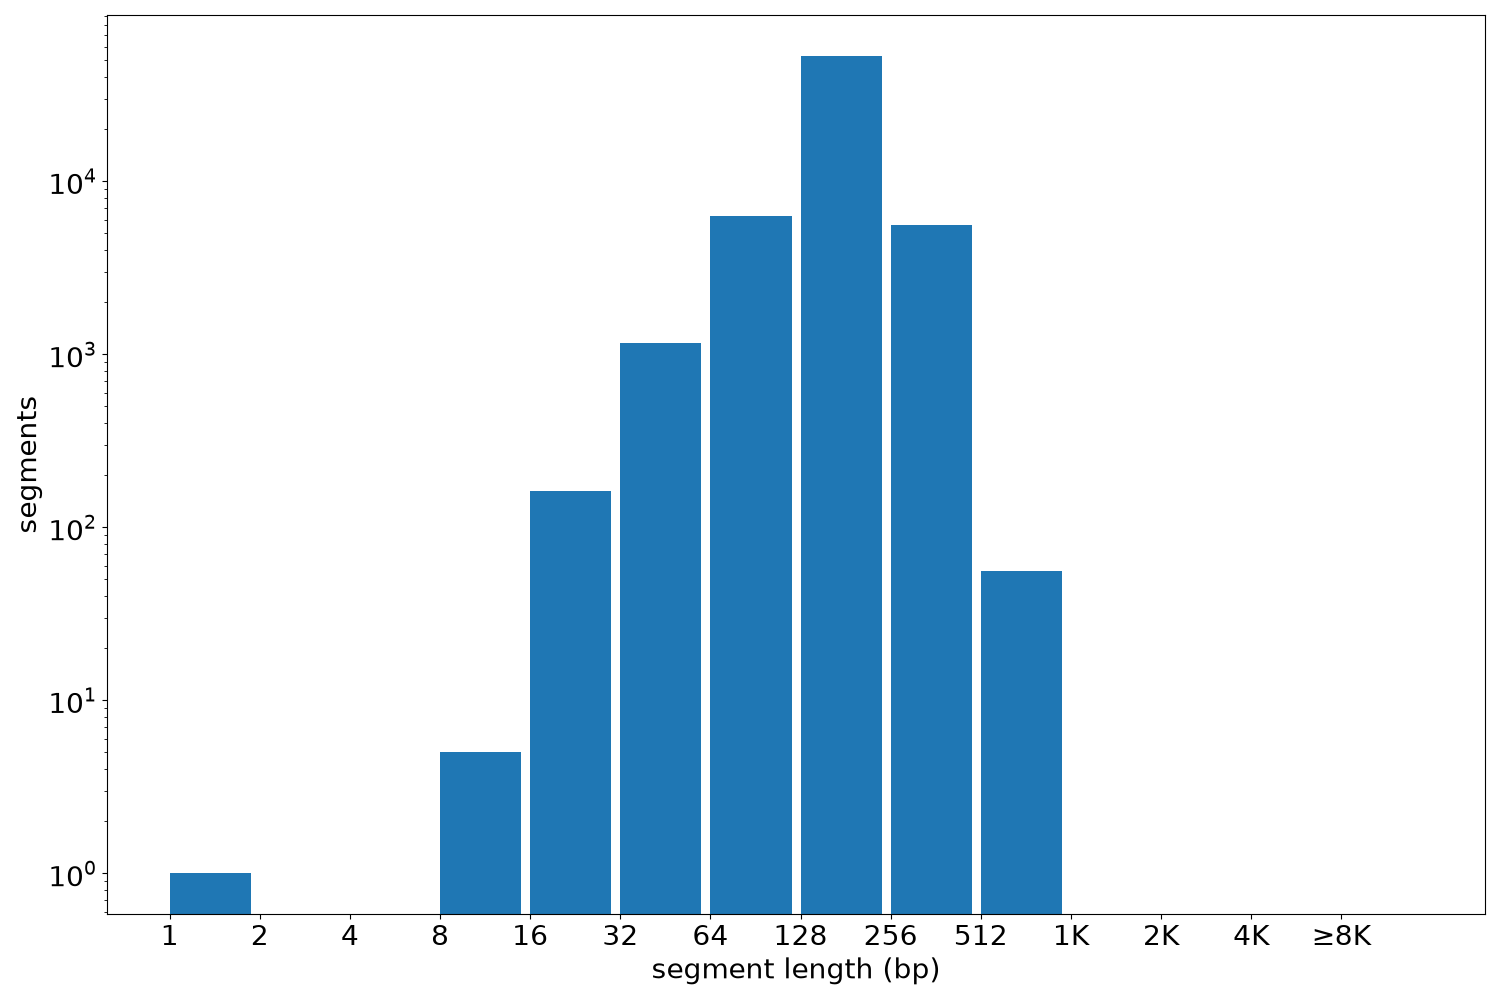
Segment lengths
| segments | min | max | mean | median | |
|---|---|---|---|---|---|
| segments | 66338 | 1 | 783 | 184.6 | 180 |
Files
| Filename | Size | md5 |
|---|---|---|
| ENCFF652TDB.bed.gz | 752.44 KB | 82c898607f3631fde9ecb51aec3382ce |
| ENCFF652TDB.tabix.bed.gz | 686.12 KB | 446fc5b0c178d0c853850ced8beed23b |
| ENCFF652TDB.tabix.bed.gz.tbi | 277.99 KB | 226949d14a6cca27a3cb06917403de8e |
| genomic_resource.yaml | 2.33 KB | 8eb7b9da19e5a84211faf802ff3e15e7 |
| statistics/ |