Resource
| Id | DNase-seq/ENCSR429RHR |
|---|---|
| Type | position_score |
| Version | 0 |
| Summary | DNase-seq ENCSR429RHR [biosample_summary="Homo sapiens RKO"] |
| Description |
status: released biological_replicates: Rep 2 summary: output_type: peaks audit_warning: Signal Portion of Tags (SPOT) is a measure of enrichment, analogous to the commonly used fraction of reads in peaks metric. ENCODE processed alignment files {ENCFF290RFC|/files/ENCFF290RFC/} processed by DNase-seq ENCODE4 v3.0.0-alpha.2 GRCh38 pipeline ({ENCPL848KLD|/pipelines/ENCPL848KLD/}) for GRCh38 assembly have a SPOT1 score of 0.32. According to ENCODE standards, SPOT1 score of 0.4 or higher is considered a product of high quality data. Any sample with a SPOT1 score <0.3 should be targeted for replacement with a higher quality sample, and a SPOT1 score of 0.25 is considered minimally acceptable SPOT1 score of 0.25 is considered minimally acceptable for rare and hard to find primary tissues. (See {ENCODE DNase-seq data standards|/data-standards/dnase-seq-encode4/}) audit_warning: Signal Portion of Tags (SPOT) is a measure of enrichment, analogous to the commonly used fraction of reads in peaks metric. ENCODE processed alignment files {ENCFF881HKH|/files/ENCFF881HKH/} processed by DNase-seq ENCODE4 v3.0.0-alpha.2 GRCh38 pipeline ({ENCPL848KLD|/pipelines/ENCPL848KLD/}) for GRCh38 assembly have a SPOT1 score of 0.39. According to ENCODE standards, SPOT1 score of 0.4 or higher is considered a product of high quality data. Any sample with a SPOT1 score <0.3 should be targeted for replacement with a higher quality sample, and a SPOT1 score of 0.25 is considered minimally acceptable SPOT1 score of 0.25 is considered minimally acceptable for rare and hard to find primary tissues. (See {ENCODE DNase-seq data standards|/data-standards/dnase-seq-encode4/}) |
| Labels |
|
Scores (1)
| ID | Type | Default annotation | Description | Histogram | Range | Summary |
|---|---|---|---|---|---|---|
| DNase-seq_ENCSR429RHR | float |
DNase-seq_ENCSR429RHR |
DNase-seq ENCSR429RHR [biosample_summary="Homo sapiens RKO"]
|
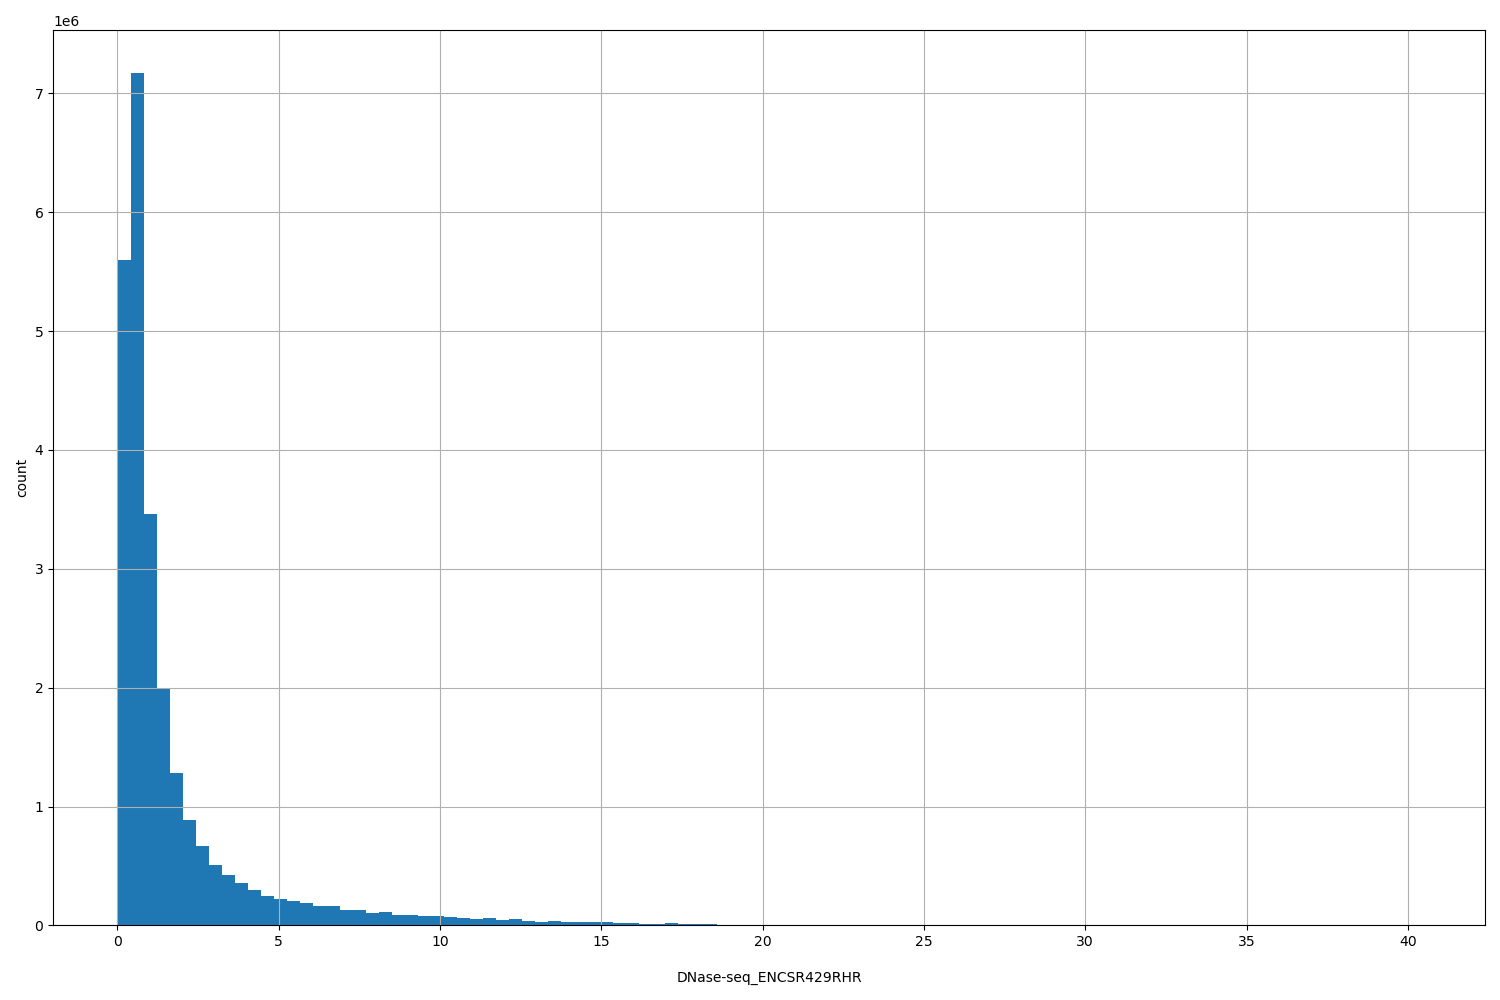 |
[0.0331, 40.4] |
|
n counts base pairs; sd is the population standard deviation.
Coverage
| Chromosome | Covered positions | Covered % | Segments |
|---|---|---|---|
| all chromosomes | 25371521 | 0.79% | 141402 |
| chr1 | 2327841 | 0.94% | 12775 |
| chr2 | 1859385 | 0.77% | 10545 |
| chr3 | 1582892 | 0.80% | 8909 |
| chr4 | 1312557 | 0.69% | 7552 |
| chr5 | 1403396 | 0.77% | 7890 |
| chr6 | 1455236 | 0.85% | 8099 |
| chr7 | 1369657 | 0.86% | 7634 |
| chr8 | 1342186 | 0.92% | 7574 |
| chr9 | 1165804 | 0.84% | 6376 |
| chr10 | 1199511 | 0.90% | 6686 |
| chr11 | 1227154 | 0.91% | 6772 |
| chr12 | 1307138 | 0.98% | 7229 |
| chr13 | 659517 | 0.58% | 3827 |
| chr14 | 792759 | 0.74% | 4369 |
| chr15 | 757408 | 0.74% | 4206 |
| chr16 | 808135 | 0.89% | 4440 |
| chr17 | 1078731 | 1.30% | 5847 |
| chr18 | 505781 | 0.63% | 2923 |
| chr19 | 1038667 | 1.77% | 5478 |
| chr20 | 685822 | 1.06% | 3859 |
| chr21 | 252166 | 0.54% | 1407 |
| chr22 | 445465 | 0.88% | 2465 |
| chrX | 793380 | 0.51% | 4533 |
| chrY | 933 | <0.01% | 7 |
| 3342 contigs with no values (129077085 bp) | 0 | 0.00% | 0 |
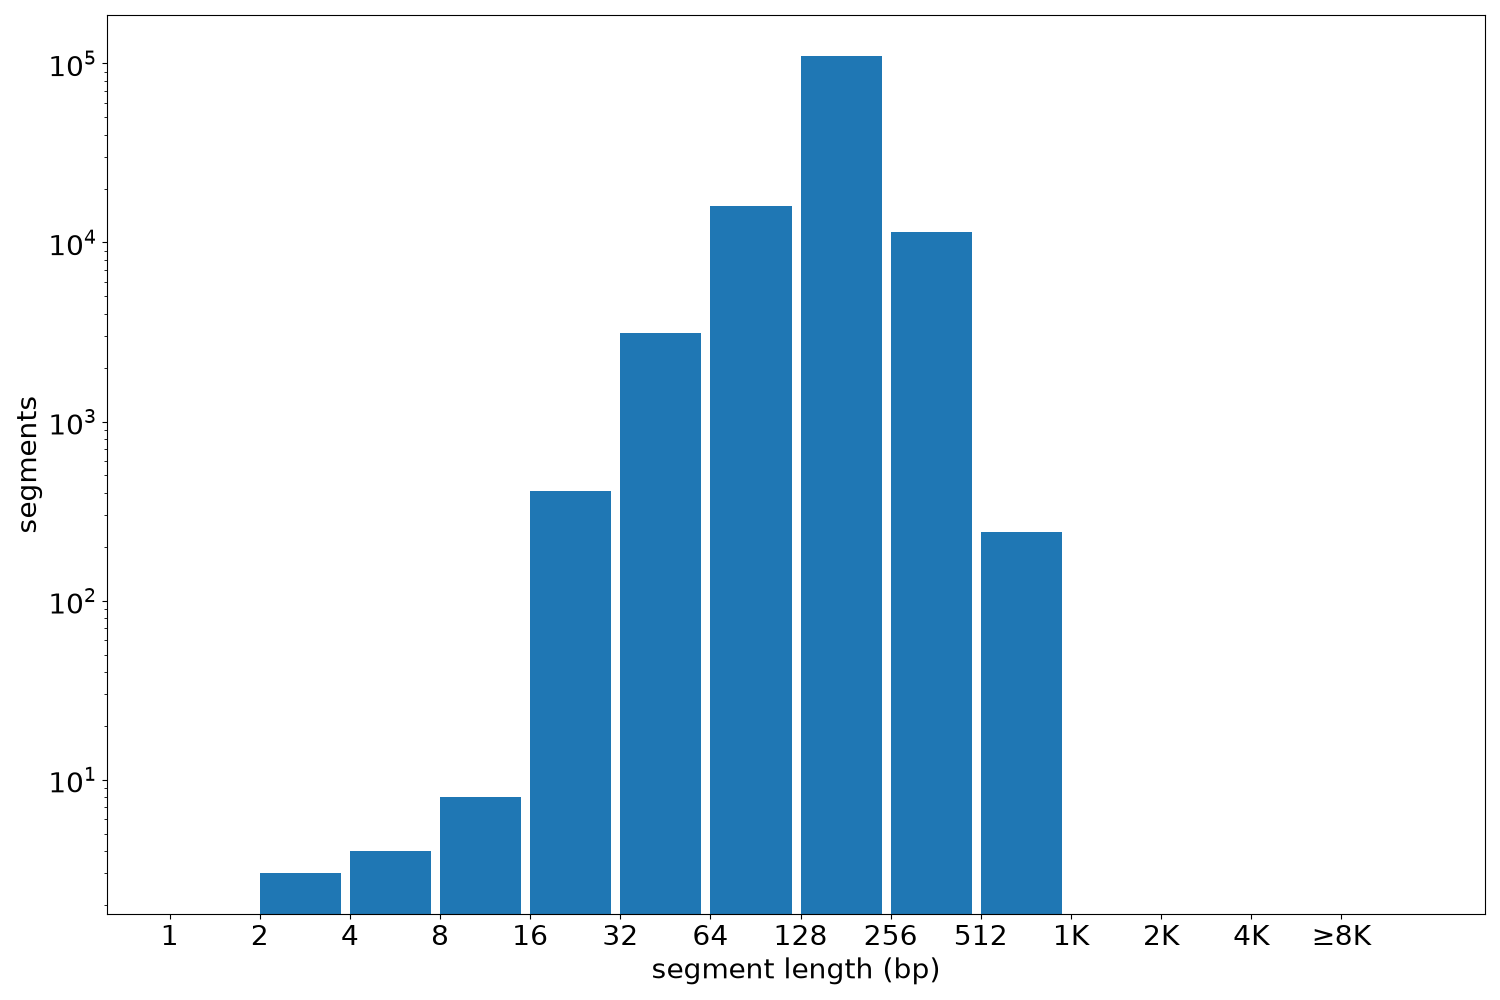
Segment lengths
| segments | min | max | mean | median | |
|---|---|---|---|---|---|
| segments | 141402 | 3 | 880 | 179.43 | 180 |
Files
| Filename | Size | md5 |
|---|---|---|
| ENCFF778MLM.bed.gz | 1.53 MB | 5b36e51a354ec7710d81940cbe75d1b8 |
| ENCFF778MLM.tabix.bed.gz | 1.39 MB | 4c08abd9cecc1b7800e24792a1c1ef6d |
| ENCFF778MLM.tabix.bed.gz.tbi | 544.7 KB | d0b29164886fd860664a159b68afd9a4 |
| genomic_resource.yaml | 2.76 KB | 6c1749569c11fe1ab089ac825067fc7c |
| statistics/ |