Resource
| Id | DNase-seq/ENCSR420NOA |
|---|---|
| Type | position_score |
| Version | 0 |
| Summary | DNase-seq ENCSR420NOA [biosample_summary="Homo sapiens hematopoietic multipotent progenitor cell treated with interleukin-3 for 11 days, kit ligand for 11 days, hydrocortisone succinate for 11 days, erythropoietin for 11 days"] |
| Description |
status: released biological_replicates: Rep 1 summary: male adult (25 years) treated with interleukin-3 for 11 days, kit ligand for 11 days, hydrocortisone succinate for 11 days, erythropoietin for 11 days output_type: peaks audit_error: Signal Portion of Tags (SPOT) is a measure of enrichment, analogous to the commonly used fraction of reads in peaks metric. ENCODE processed alignment files {ENCFF893TZO|/files/ENCFF893TZO/} processed by DNase-seq ENCODE4 v3.0.0-alpha.2 GRCh38 pipeline ({ENCPL848KLD|/pipelines/ENCPL848KLD/}) for GRCh38 assembly have a SPOT1 score of 0.14. According to ENCODE standards, SPOT1 score of 0.4 or higher is considered a product of high quality data. Any sample with a SPOT1 score <0.3 should be targeted for replacement with a higher quality sample, and a SPOT1 score of 0.25 is considered minimally acceptable SPOT1 score of 0.25 is considered minimally acceptable for rare and hard to find primary tissues. (See {ENCODE DNase-seq data standards|/data-standards/dnase-seq-encode4/}) audit_warning: Signal Portion of Tags (SPOT) is a measure of enrichment, analogous to the commonly used fraction of reads in peaks metric. ENCODE processed alignment files {ENCFF973FCP|/files/ENCFF973FCP/} processed by DNase-seq ENCODE4 v3.0.0-alpha.2 GRCh38 pipeline ({ENCPL848KLD|/pipelines/ENCPL848KLD/}) for GRCh38 assembly have a SPOT1 score of 0.27. According to ENCODE standards, SPOT1 score of 0.4 or higher is considered a product of high quality data. Any sample with a SPOT1 score <0.3 should be targeted for replacement with a higher quality sample, and a SPOT1 score of 0.25 is considered minimally acceptable SPOT1 score of 0.25 is considered minimally acceptable for rare and hard to find primary tissues. (See {ENCODE DNase-seq data standards|/data-standards/dnase-seq-encode4/}) audit_warning: Signal Portion of Tags (SPOT) is a measure of enrichment, analogous to the commonly used fraction of reads in peaks metric. ENCODE processed alignment files {ENCFF255ALH|/files/ENCFF255ALH/} processed by DNase-seq ENCODE4 v3.0.0-alpha.2 GRCh38 pipeline ({ENCPL848KLD|/pipelines/ENCPL848KLD/}) for GRCh38 assembly have a SPOT1 score of 0.26. According to ENCODE standards, SPOT1 score of 0.4 or higher is considered a product of high quality data. Any sample with a SPOT1 score <0.3 should be targeted for replacement with a higher quality sample, and a SPOT1 score of 0.25 is considered minimally acceptable SPOT1 score of 0.25 is considered minimally acceptable for rare and hard to find primary tissues. (See {ENCODE DNase-seq data standards|/data-standards/dnase-seq-encode4/}) |
| Labels |
|
Scores (1)
| ID | Type | Default annotation | Description | Histogram | Range | Summary |
|---|---|---|---|---|---|---|
| DNase-seq_ENCSR420NOA | float |
DNase-seq_ENCSR420NOA |
DNase-seq ENCSR420NOA [biosample_summary="Homo sapiens hematopoietic multipotent progenitor cell treated with interleukin-3 for 11 days, kit ligand for 11 days, hydrocortisone succinate for 11 days, erythropoietin for 11 days"]
|
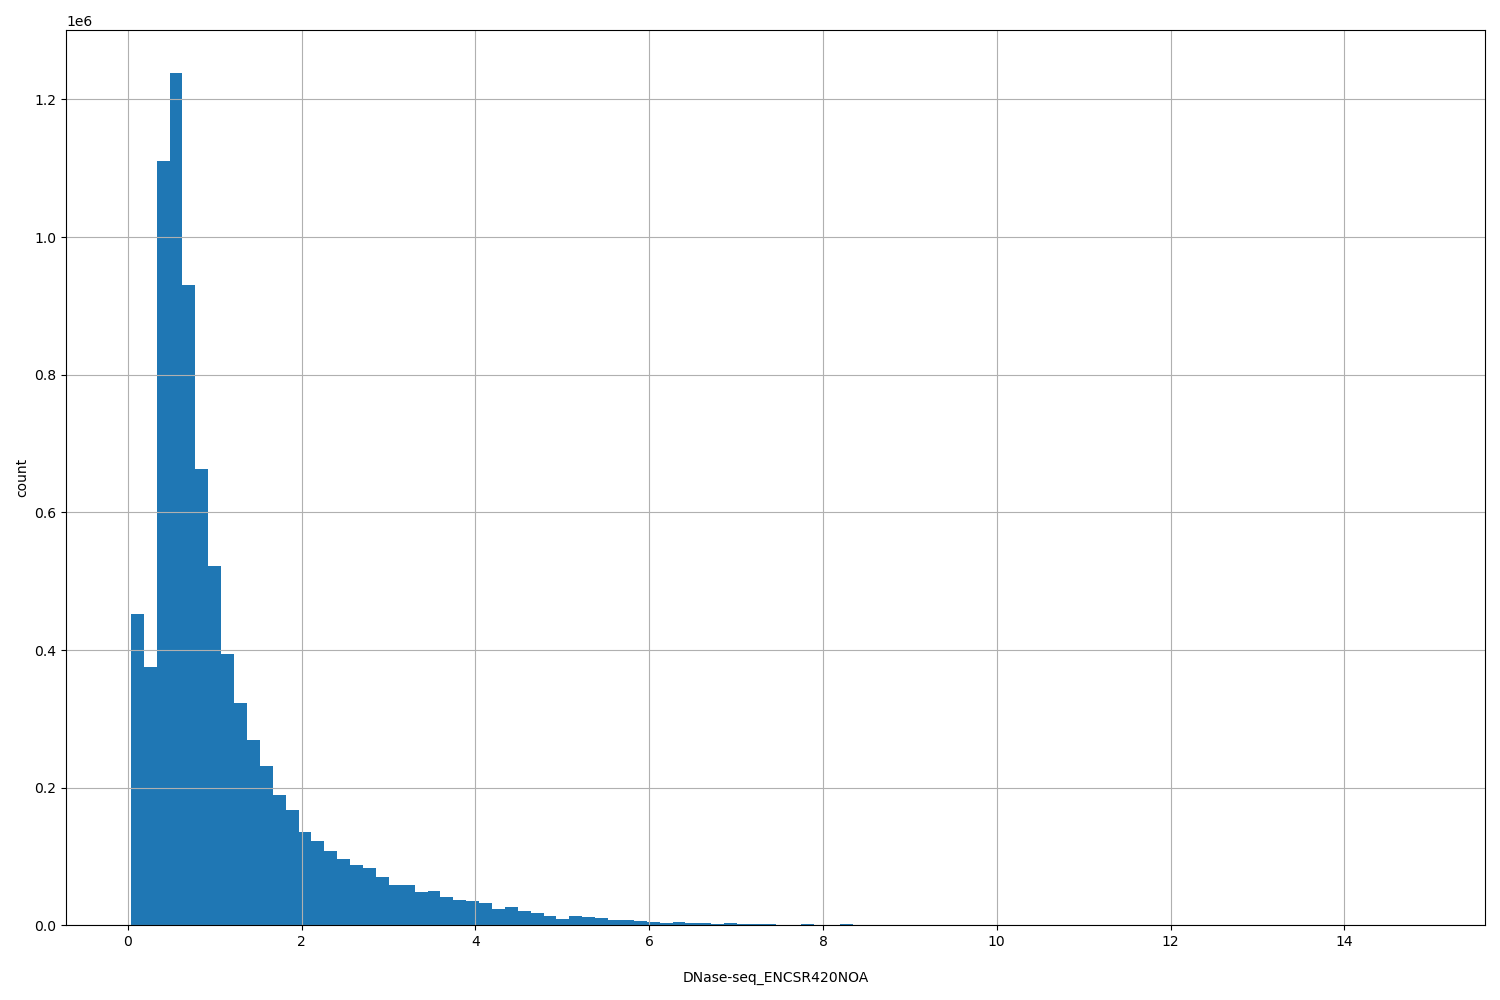 |
[0.0352, 14.9] |
|
n counts base pairs; sd is the population standard deviation.
Coverage
| Chromosome | Covered positions | Covered % | Segments |
|---|---|---|---|
| all chromosomes | 8148210 | 0.25% | 40554 |
| chr1 | 820429 | 0.33% | 4099 |
| chr2 | 581174 | 0.24% | 2912 |
| chr3 | 485372 | 0.24% | 2419 |
| chr4 | 350141 | 0.18% | 1707 |
| chr5 | 391162 | 0.22% | 1952 |
| chr6 | 537227 | 0.31% | 2583 |
| chr7 | 370865 | 0.23% | 1851 |
| chr8 | 314611 | 0.22% | 1587 |
| chr9 | 323691 | 0.23% | 1632 |
| chr10 | 339699 | 0.25% | 1706 |
| chr11 | 424987 | 0.31% | 2125 |
| chr12 | 416092 | 0.31% | 2037 |
| chr13 | 179556 | 0.16% | 866 |
| chr14 | 256828 | 0.24% | 1307 |
| chr15 | 261303 | 0.26% | 1297 |
| chr16 | 330990 | 0.37% | 1689 |
| chr17 | 421328 | 0.51% | 2121 |
| chr18 | 143567 | 0.18% | 715 |
| chr19 | 456103 | 0.78% | 2238 |
| chr20 | 200054 | 0.31% | 1026 |
| chr21 | 89583 | 0.19% | 445 |
| chr22 | 192753 | 0.38% | 961 |
| chrX | 242594 | 0.16% | 1190 |
| chrY | 18101 | 0.03% | 89 |
| 3342 contigs with no values (129077085 bp) | 0 | 0.00% | 0 |
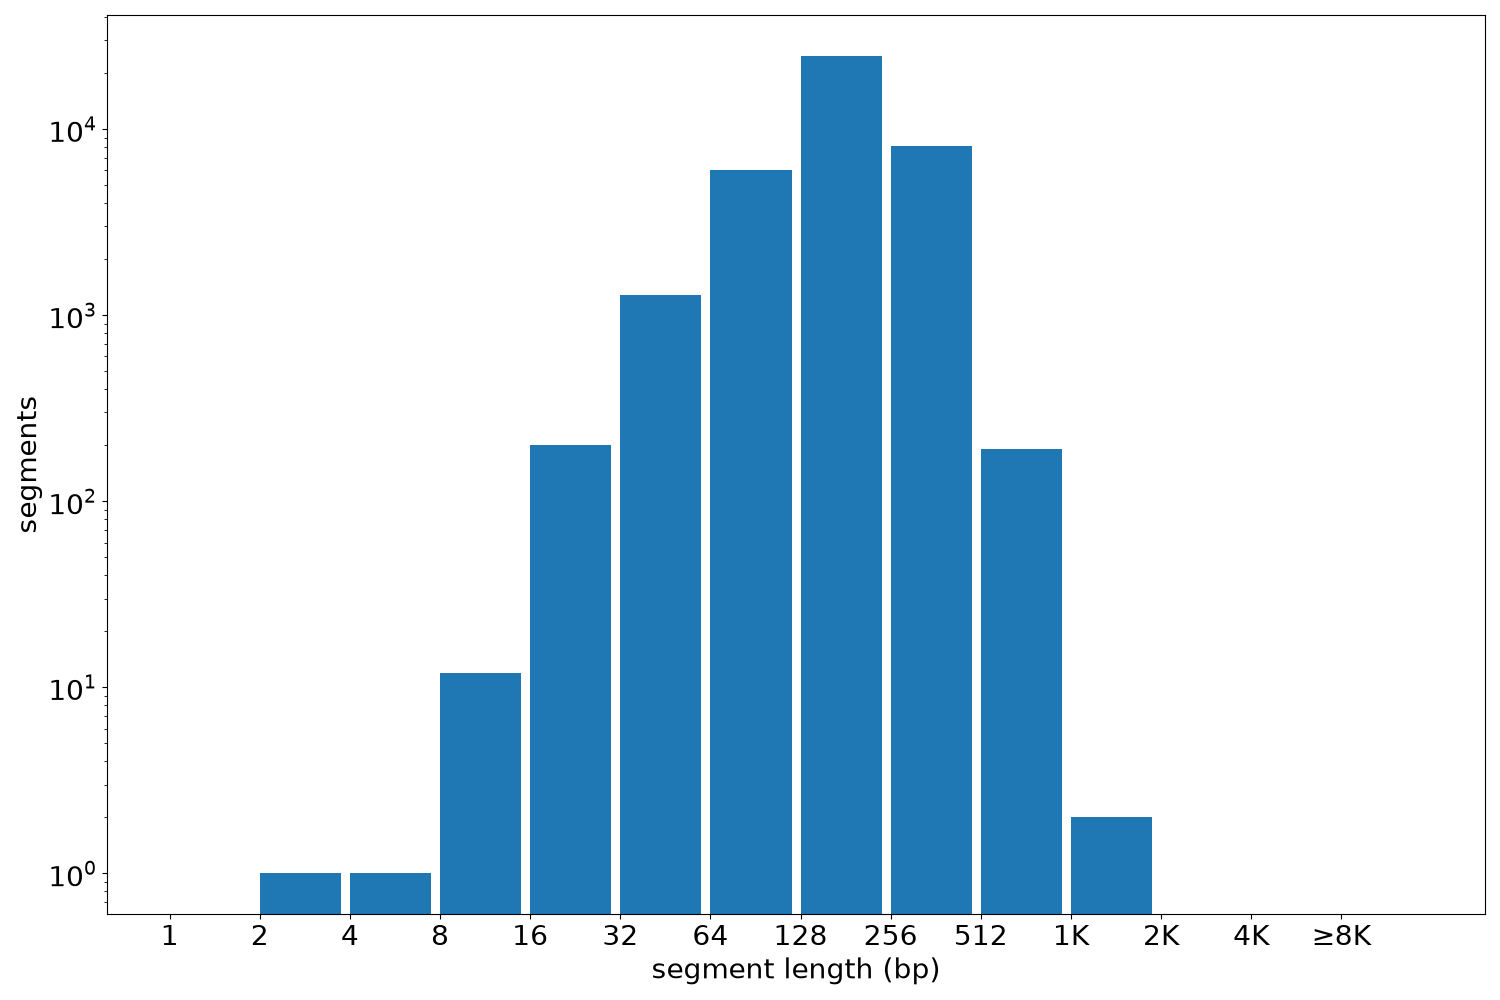
Segment lengths
| segments | min | max | mean | median | |
|---|---|---|---|---|---|
| segments | 40554 | 3 | 1160 | 200.92 | 200 |
Files
| Filename | Size | md5 |
|---|---|---|
| ENCFF377CYT.bed.gz | 452.91 KB | 66b14dc722ec42587d1408ebfb89c7b9 |
| ENCFF377CYT.tabix.bed.gz | 416.06 KB | dc6f05e5be55fb94fc742d6187d90b49 |
| ENCFF377CYT.tabix.bed.gz.tbi | 213.88 KB | 643e71d63f7843232b54da83df1136e3 |
| genomic_resource.yaml | 4.36 KB | 6dc9a29ef2665c5b4739625083e8de9f |
| statistics/ |