Resource
| Id | DNase-seq/ENCSR401UZL |
|---|---|
| Type | position_score |
| Version | 0 |
| Summary | DNase-seq ENCSR401UZL [biosample_summary="Homo sapiens dorsolateral prefrontal cortex tissue male adult (78 years)"] |
| Description |
status: released biological_replicates: Rep 1 summary: male adult (78 years) output_type: peaks audit_warning: Signal Portion of Tags (SPOT) is a measure of enrichment, analogous to the commonly used fraction of reads in peaks metric. ENCODE processed alignment files {ENCFF301WKE|/files/ENCFF301WKE/} processed by DNase-seq ENCODE4 v3.0.0-alpha.2 GRCh38 pipeline ({ENCPL848KLD|/pipelines/ENCPL848KLD/}) for GRCh38 assembly have a SPOT1 score of 0.34. According to ENCODE standards, SPOT1 score of 0.4 or higher is considered a product of high quality data. Any sample with a SPOT1 score <0.3 should be targeted for replacement with a higher quality sample, and a SPOT1 score of 0.25 is considered minimally acceptable SPOT1 score of 0.25 is considered minimally acceptable for rare and hard to find primary tissues. (See {ENCODE DNase-seq data standards|/data-standards/dnase-seq-encode4/}) |
| Labels |
|
Scores (1)
| ID | Type | Default annotation | Description | Histogram | Range | Summary |
|---|---|---|---|---|---|---|
| DNase-seq_ENCSR401UZL | float |
DNase-seq_ENCSR401UZL |
DNase-seq ENCSR401UZL [biosample_summary="Homo sapiens dorsolateral prefrontal cortex tissue male adult (78 years)"]
|
 |
[0.0603, 14.9] |
|
n counts base pairs; sd is the population standard deviation.
Coverage
| Chromosome | Covered positions | Covered % | Segments |
|---|---|---|---|
| all chromosomes | 17712765 | 0.55% | 94118 |
| chr1 | 1634966 | 0.66% | 8778 |
| chr2 | 1560429 | 0.64% | 8260 |
| chr3 | 813974 | 0.41% | 4435 |
| chr4 | 596218 | 0.31% | 3133 |
| chr5 | 783438 | 0.43% | 4187 |
| chr6 | 642335 | 0.38% | 3462 |
| chr7 | 944756 | 0.59% | 5013 |
| chr8 | 797331 | 0.55% | 4197 |
| chr9 | 751103 | 0.54% | 4027 |
| chr10 | 1022628 | 0.76% | 5362 |
| chr11 | 1068146 | 0.79% | 5609 |
| chr12 | 705738 | 0.53% | 3799 |
| chr13 | 325638 | 0.28% | 1731 |
| chr14 | 592906 | 0.55% | 3174 |
| chr15 | 645059 | 0.63% | 3445 |
| chr16 | 746414 | 0.83% | 3992 |
| chr17 | 1074876 | 1.29% | 5710 |
| chr18 | 296648 | 0.37% | 1636 |
| chr19 | 741894 | 1.27% | 3830 |
| chr20 | 612313 | 0.95% | 3295 |
| chr21 | 310922 | 0.67% | 1596 |
| chr22 | 748297 | 1.47% | 3835 |
| chrX | 287690 | 0.18% | 1552 |
| chrY | 9046 | 0.02% | 60 |
| 3342 contigs with no values (129077085 bp) | 0 | 0.00% | 0 |
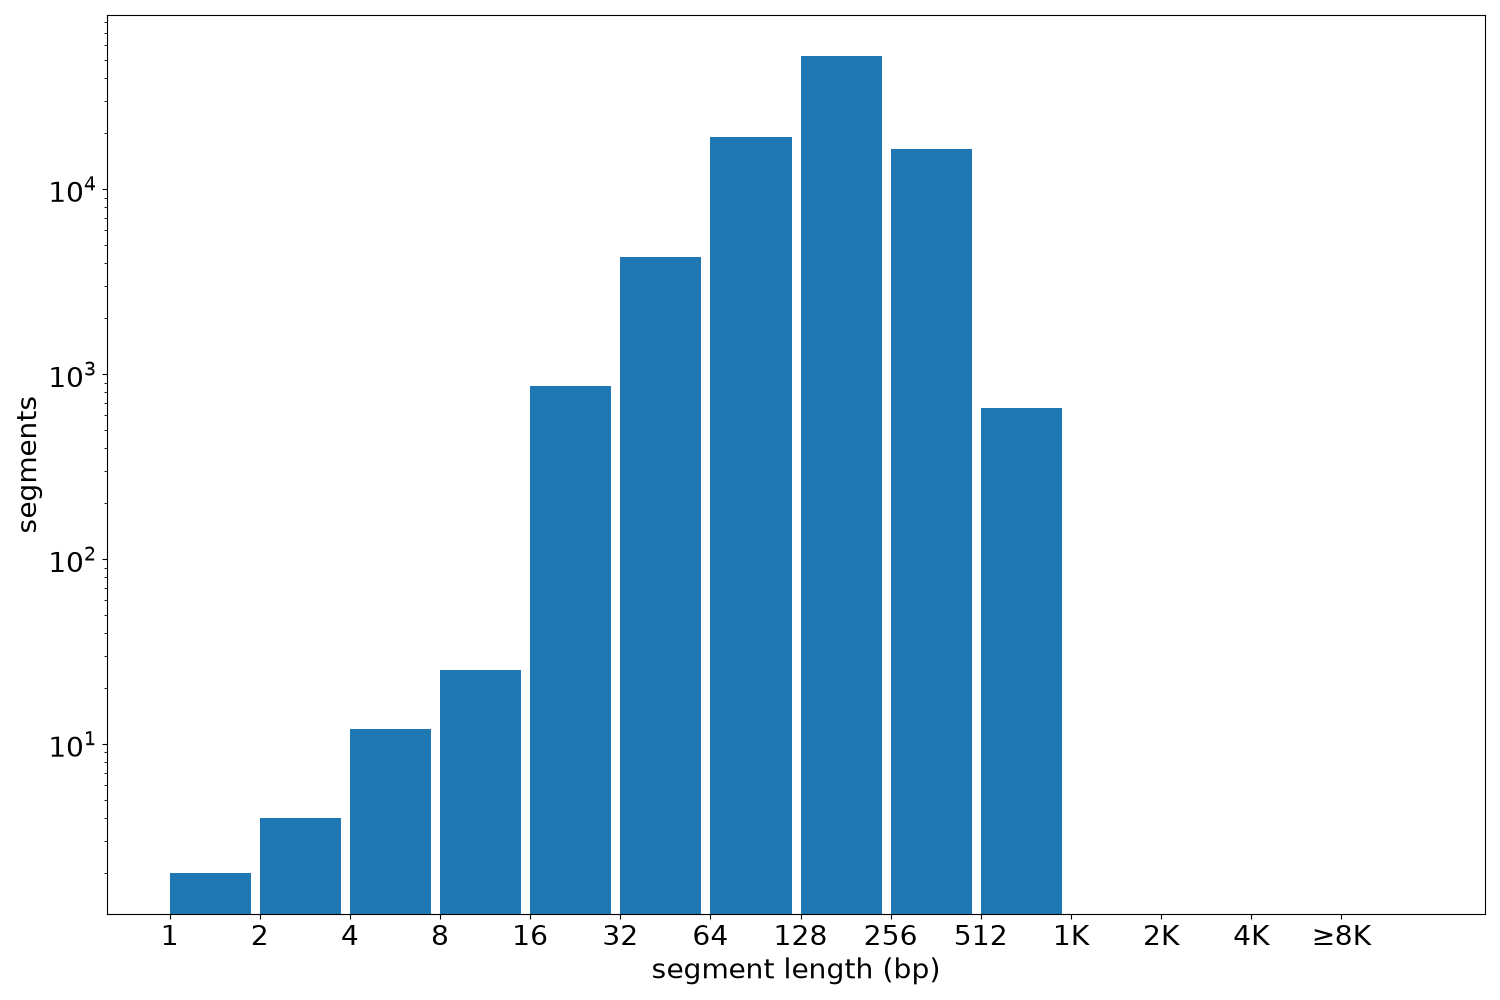
Segment lengths
| segments | min | max | mean | median | |
|---|---|---|---|---|---|
| segments | 94118 | 1 | 915 | 188.2 | 180 |
Files
| Filename | Size | md5 |
|---|---|---|
| ENCFF864LVN.bed.gz | 967.58 KB | ea14f8b75dc751fe238618438577353e |
| ENCFF864LVN.tabix.bed.gz | 886.73 KB | bb79a86837b587f931e9df62f27e785c |
| ENCFF864LVN.tabix.bed.gz.tbi | 266.66 KB | 43b05d795703ce160819b72a41cf58a9 |
| genomic_resource.yaml | 2.09 KB | df3f877496fb3336753e98b463d17141 |
| statistics/ |