Resource
| Id | DNase-seq/ENCSR398JUP |
|---|---|
| Type | position_score |
| Version | 0 |
| Summary | DNase-seq ENCSR398JUP [biosample_summary="Homo sapiens ureter tissue female adult (47 years)"] |
| Description |
status: released biological_replicates: Rep 1 summary: female adult (47 years) output_type: peaks audit_warning: Signal Portion of Tags (SPOT) is a measure of enrichment, analogous to the commonly used fraction of reads in peaks metric. ENCODE processed alignment files {ENCFF964BCG|/files/ENCFF964BCG/} processed by DNase-seq ENCODE4 v3.0.0-alpha.2 GRCh38 pipeline ({ENCPL848KLD|/pipelines/ENCPL848KLD/}) for GRCh38 assembly have a SPOT1 score of 0.31. According to ENCODE standards, SPOT1 score of 0.4 or higher is considered a product of high quality data. Any sample with a SPOT1 score <0.3 should be targeted for replacement with a higher quality sample, and a SPOT1 score of 0.25 is considered minimally acceptable SPOT1 score of 0.25 is considered minimally acceptable for rare and hard to find primary tissues. (See {ENCODE DNase-seq data standards|/data-standards/dnase-seq-encode4/}) |
| Labels |
|
Scores (1)
| ID | Type | Default annotation | Description | Histogram | Range | Summary |
|---|---|---|---|---|---|---|
| DNase-seq_ENCSR398JUP | float |
DNase-seq_ENCSR398JUP |
DNase-seq ENCSR398JUP [biosample_summary="Homo sapiens ureter tissue female adult (47 years)"]
|
 |
[0.0392, 16] |
|
n counts base pairs; sd is the population standard deviation.
Coverage
| Chromosome | Covered positions | Covered % | Segments |
|---|---|---|---|
| all chromosomes | 21442622 | 0.67% | 109701 |
| chr1 | 2015335 | 0.81% | 10236 |
| chr2 | 1946900 | 0.80% | 9870 |
| chr3 | 1145259 | 0.58% | 5894 |
| chr4 | 644960 | 0.34% | 3365 |
| chr5 | 1020728 | 0.56% | 5240 |
| chr6 | 967008 | 0.57% | 5019 |
| chr7 | 1047538 | 0.66% | 5417 |
| chr8 | 941598 | 0.65% | 4827 |
| chr9 | 994215 | 0.72% | 5036 |
| chr10 | 1250666 | 0.93% | 6438 |
| chr11 | 1183649 | 0.88% | 6003 |
| chr12 | 820164 | 0.62% | 4238 |
| chr13 | 396453 | 0.35% | 2087 |
| chr14 | 680434 | 0.64% | 3504 |
| chr15 | 829750 | 0.81% | 4238 |
| chr16 | 774575 | 0.86% | 3917 |
| chr17 | 1118041 | 1.34% | 5635 |
| chr18 | 514149 | 0.64% | 2702 |
| chr19 | 956963 | 1.63% | 4766 |
| chr20 | 731049 | 1.13% | 3791 |
| chr21 | 328941 | 0.70% | 1688 |
| chr22 | 630217 | 1.24% | 3168 |
| chrX | 502728 | 0.32% | 2611 |
| chrY | 1302 | <0.01% | 11 |
| 3342 contigs with no values (129077085 bp) | 0 | 0.00% | 0 |
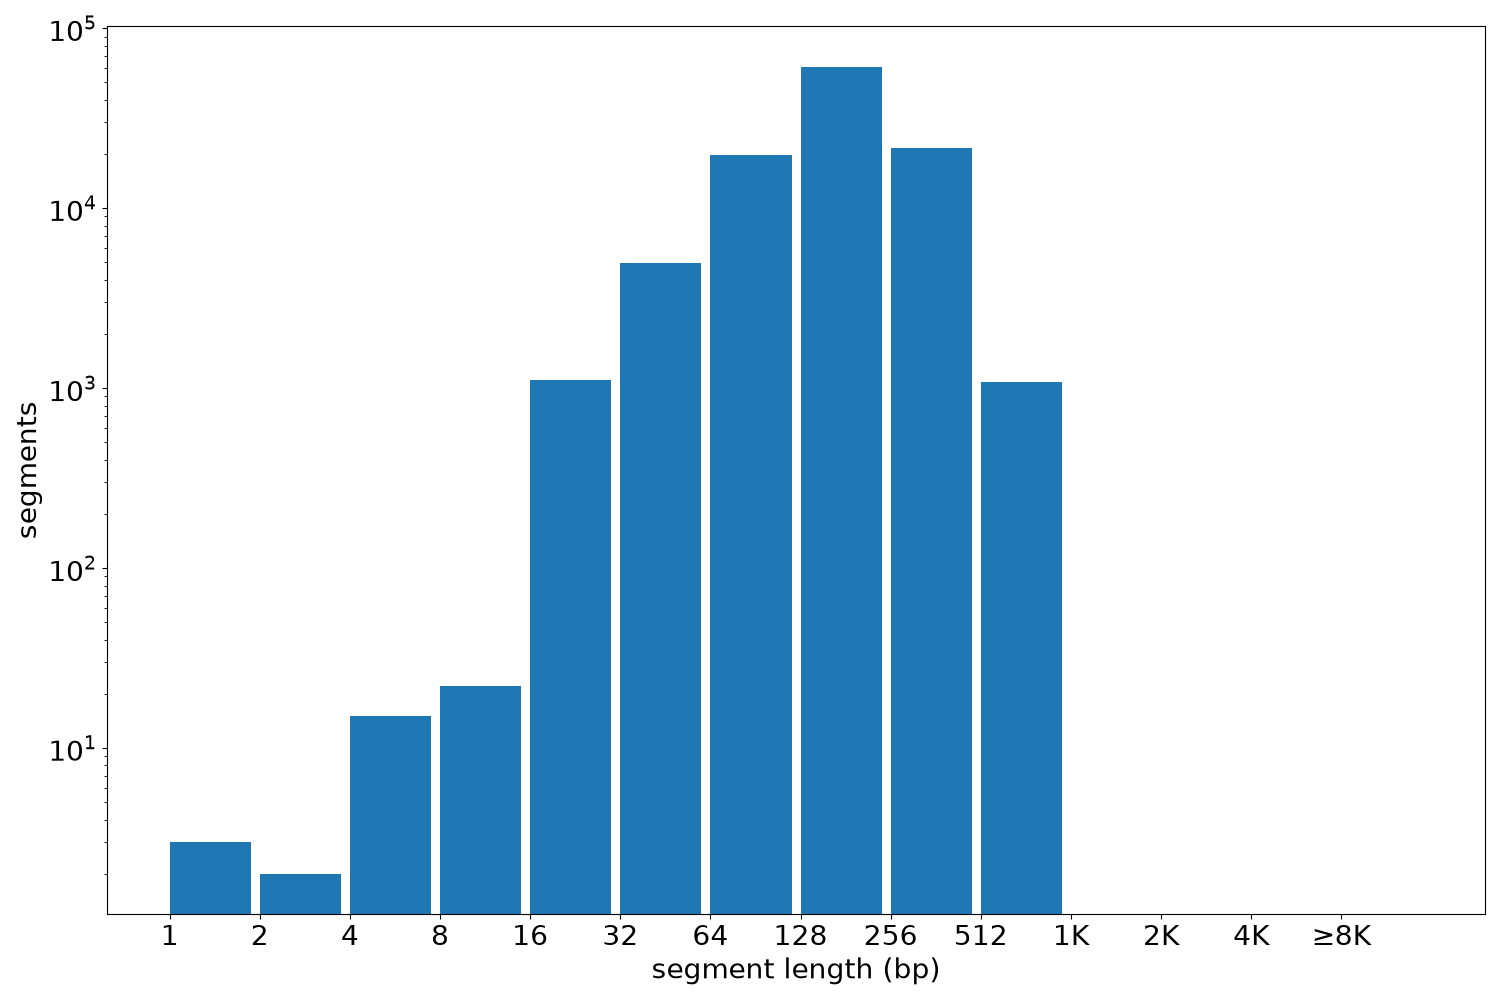
Segment lengths
| segments | min | max | mean | median | |
|---|---|---|---|---|---|
| segments | 109701 | 1 | 960 | 195.46 | 184 |
Files
| Filename | Size | md5 |
|---|---|---|
| ENCFF635FNH.bed.gz | 1.13 MB | 2fba43c7a7e5c154a22b4ee3492d5778 |
| ENCFF635FNH.tabix.bed.gz | 1.04 MB | 27f5acb25e088854ddc94a9742dec6a2 |
| ENCFF635FNH.tabix.bed.gz.tbi | 305.03 KB | 8c50fdb3aa45780eefce75a7d2b458f7 |
| genomic_resource.yaml | 2.03 KB | c8ea07011f5f0d545354411872e34cc3 |
| statistics/ |