Resource
| Id | DNase-seq/ENCSR391YAV |
|---|---|
| Type | position_score |
| Version | 0 |
| Summary | DNase-seq ENCSR391YAV [biosample_summary="Homo sapiens sigmoid colon tissue male adult (54 years)"] |
| Description |
status: released biological_replicates: Rep 1 summary: male adult (54 years) output_type: peaks audit_error: Signal Portion of Tags (SPOT) is a measure of enrichment, analogous to the commonly used fraction of reads in peaks metric. ENCODE processed alignment files {ENCFF332SHA|/files/ENCFF332SHA/} processed by DNase-seq ENCODE3 GRCh38 pipeline ({ENCPL202DNS|/pipelines/ENCPL202DNS/}) for GRCh38 assembly have a SPOT1 score of 0.25. According to ENCODE standards, SPOT1 score of 0.4 or higher is considered a product of high quality data. Any sample with a SPOT1 score <0.3 should be targeted for replacement with a higher quality sample, and a SPOT1 score of 0.25 is considered minimally acceptable SPOT1 score of 0.25 is considered minimally acceptable for rare and hard to find primary tissues. (See {ENCODE DNase-seq data standards|/data-standards/dnase-seq/}) audit_internal_action: Archived analysis {ENCAN293WTB|/analyses/ENCAN293WTB/} has in progress subobject quality standard {encode3-dnase|/quality-standards/encode3-dnase/} |
| Labels |
|
Scores (1)
| ID | Type | Default annotation | Description | Histogram | Range | Summary |
|---|---|---|---|---|---|---|
| DNase-seq_ENCSR391YAV | float |
DNase-seq_ENCSR391YAV |
DNase-seq ENCSR391YAV [biosample_summary="Homo sapiens sigmoid colon tissue male adult (54 years)"]
|
 |
[4, 9.29e+03] |
|
n counts base pairs; sd is the population standard deviation.
Coverage
| Chromosome | Covered positions | Covered % | Segments |
|---|---|---|---|
| all chromosomes | 45604901 | 1.42% | 302455 |
| chr1 | 3943486 | 1.58% | 26149 |
| chr2 | 4468330 | 1.84% | 29651 |
| chr3 | 2766017 | 1.39% | 18351 |
| chr4 | 1561192 | 0.82% | 10351 |
| chr5 | 2638446 | 1.45% | 17507 |
| chr6 | 2508455 | 1.47% | 16614 |
| chr7 | 2358668 | 1.48% | 15645 |
| chr8 | 2509241 | 1.73% | 16615 |
| chr9 | 1957178 | 1.41% | 12974 |
| chr10 | 3075951 | 2.30% | 20409 |
| chr11 | 2300523 | 1.70% | 15263 |
| chr12 | 1723100 | 1.29% | 11433 |
| chr13 | 1222930 | 1.07% | 8101 |
| chr14 | 1389005 | 1.30% | 9209 |
| chr15 | 1817133 | 1.78% | 12046 |
| chr16 | 1518203 | 1.68% | 10074 |
| chr17 | 1423467 | 1.71% | 9459 |
| chr18 | 1472436 | 1.83% | 9771 |
| chr19 | 1236293 | 2.11% | 8198 |
| chr20 | 1542829 | 2.39% | 10234 |
| chr21 | 719685 | 1.54% | 4776 |
| chr22 | 833847 | 1.64% | 5537 |
| chrX | 546713 | 0.35% | 3613 |
| chrY | 71773 | 0.13% | 475 |
| 3342 contigs with no values (129077085 bp) | 0 | 0.00% | 0 |
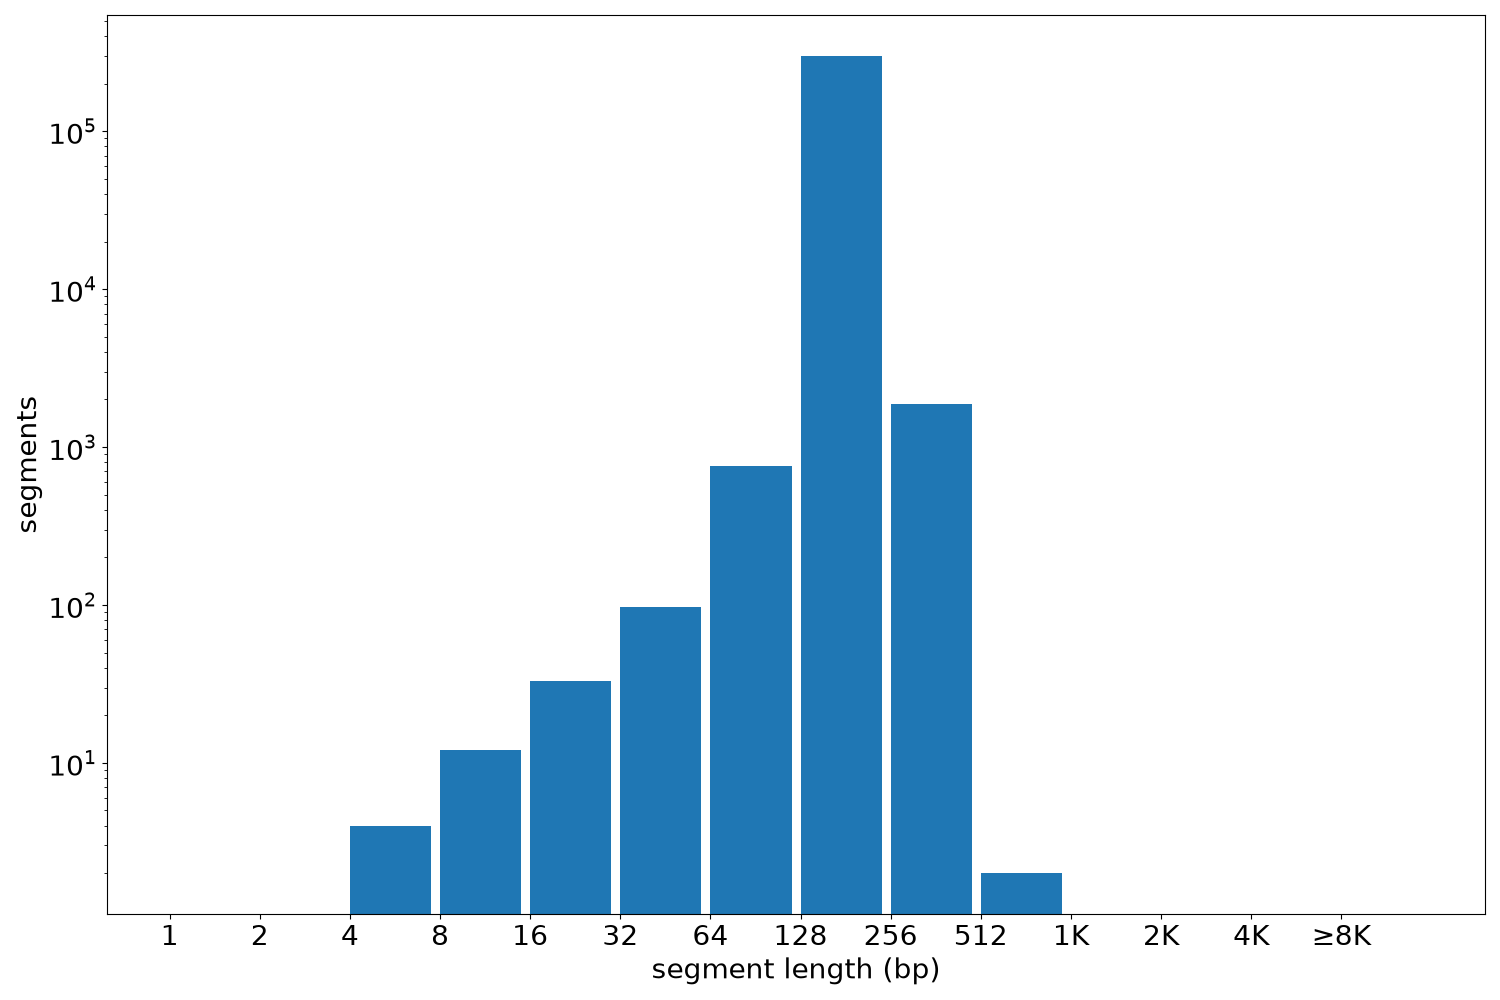
Segment lengths
| segments | min | max | mean | median | |
|---|---|---|---|---|---|
| segments | 302455 | 5 | 566 | 150.78 | 150 |
Files
| Filename | Size | md5 |
|---|---|---|
| ENCFF469JHU.bed.gz | 2.66 MB | 343645627cc2d7f823cd6e5b5d5d9053 |
| ENCFF469JHU.tabix.bed.gz | 2.3 MB | df200d294a0b1e25738722737ff97c44 |
| ENCFF469JHU.tabix.bed.gz.tbi | 380.4 KB | 0566daea8e83d10894f8f21f7d5a3876 |
| genomic_resource.yaml | 2.19 KB | 9ef0d9895c46ae6e98e54ce851f00c63 |
| statistics/ |