Resource
| Id | DNase-seq/ENCSR373BIX |
|---|---|
| Type | position_score |
| Version | 0 |
| Summary | DNase-seq ENCSR373BIX [biosample_summary="Homo sapiens CD1c-positive myeloid dendritic cell"] |
| Description |
status: released biological_replicates: Rep 1 summary: output_type: peaks audit_error: Signal Portion of Tags (SPOT) is a measure of enrichment, analogous to the commonly used fraction of reads in peaks metric. ENCODE processed alignment files {ENCFF182NPL|/files/ENCFF182NPL/} processed by DNase-seq ENCODE4 v3.0.0-alpha.2 GRCh38 pipeline ({ENCPL848KLD|/pipelines/ENCPL848KLD/}) for GRCh38 assembly have a SPOT1 score of 0.25. According to ENCODE standards, SPOT1 score of 0.4 or higher is considered a product of high quality data. Any sample with a SPOT1 score <0.3 should be targeted for replacement with a higher quality sample, and a SPOT1 score of 0.25 is considered minimally acceptable SPOT1 score of 0.25 is considered minimally acceptable for rare and hard to find primary tissues. (See {ENCODE DNase-seq data standards|/data-standards/dnase-seq-encode4/}) |
| Labels |
|
Scores (1)
| ID | Type | Default annotation | Description | Histogram | Range | Summary |
|---|---|---|---|---|---|---|
| DNase-seq_ENCSR373BIX | float |
DNase-seq_ENCSR373BIX |
DNase-seq ENCSR373BIX [biosample_summary="Homo sapiens CD1c-positive myeloid dendritic cell"]
|
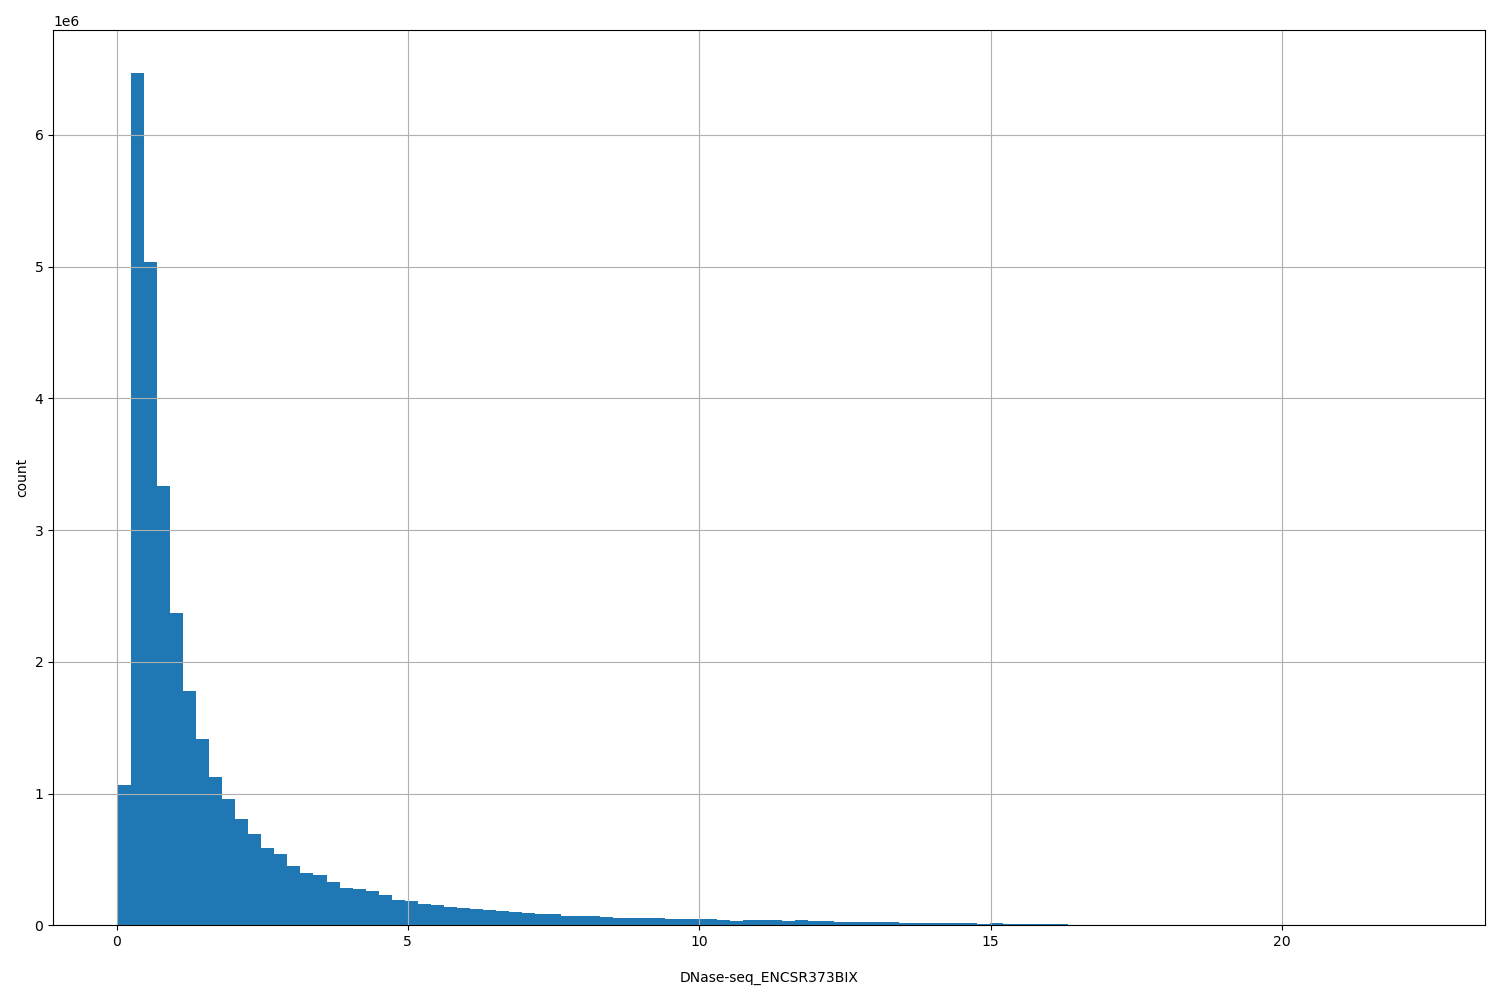 |
[0.0289, 22.4] |
|
n counts base pairs; sd is the population standard deviation.
Coverage
| Chromosome | Covered positions | Covered % | Segments |
|---|---|---|---|
| all chromosomes | 31872520 | 0.99% | 161602 |
| chr1 | 3076320 | 1.24% | 15639 |
| chr2 | 2507355 | 1.04% | 12753 |
| chr3 | 2028498 | 1.02% | 10305 |
| chr4 | 1274431 | 0.67% | 6517 |
| chr5 | 1569166 | 0.86% | 8021 |
| chr6 | 1934402 | 1.13% | 9703 |
| chr7 | 1526737 | 0.96% | 7792 |
| chr8 | 1413702 | 0.97% | 7095 |
| chr9 | 1329453 | 0.96% | 6762 |
| chr10 | 1558836 | 1.17% | 7901 |
| chr11 | 1592613 | 1.18% | 8117 |
| chr12 | 1640345 | 1.23% | 8360 |
| chr13 | 708206 | 0.62% | 3612 |
| chr14 | 1011352 | 0.94% | 5121 |
| chr15 | 1080277 | 1.06% | 5500 |
| chr16 | 1130718 | 1.25% | 5737 |
| chr17 | 1629357 | 1.96% | 8146 |
| chr18 | 640829 | 0.80% | 3218 |
| chr19 | 1358528 | 2.32% | 6726 |
| chr20 | 914465 | 1.42% | 4646 |
| chr21 | 412696 | 0.88% | 2060 |
| chr22 | 637256 | 1.25% | 3257 |
| chrX | 865575 | 0.55% | 4454 |
| chrY | 31403 | 0.05% | 160 |
| 3342 contigs with no values (129077085 bp) | 0 | 0.00% | 0 |
Segment lengths
| segments | min | max | mean | median | |
|---|---|---|---|---|---|
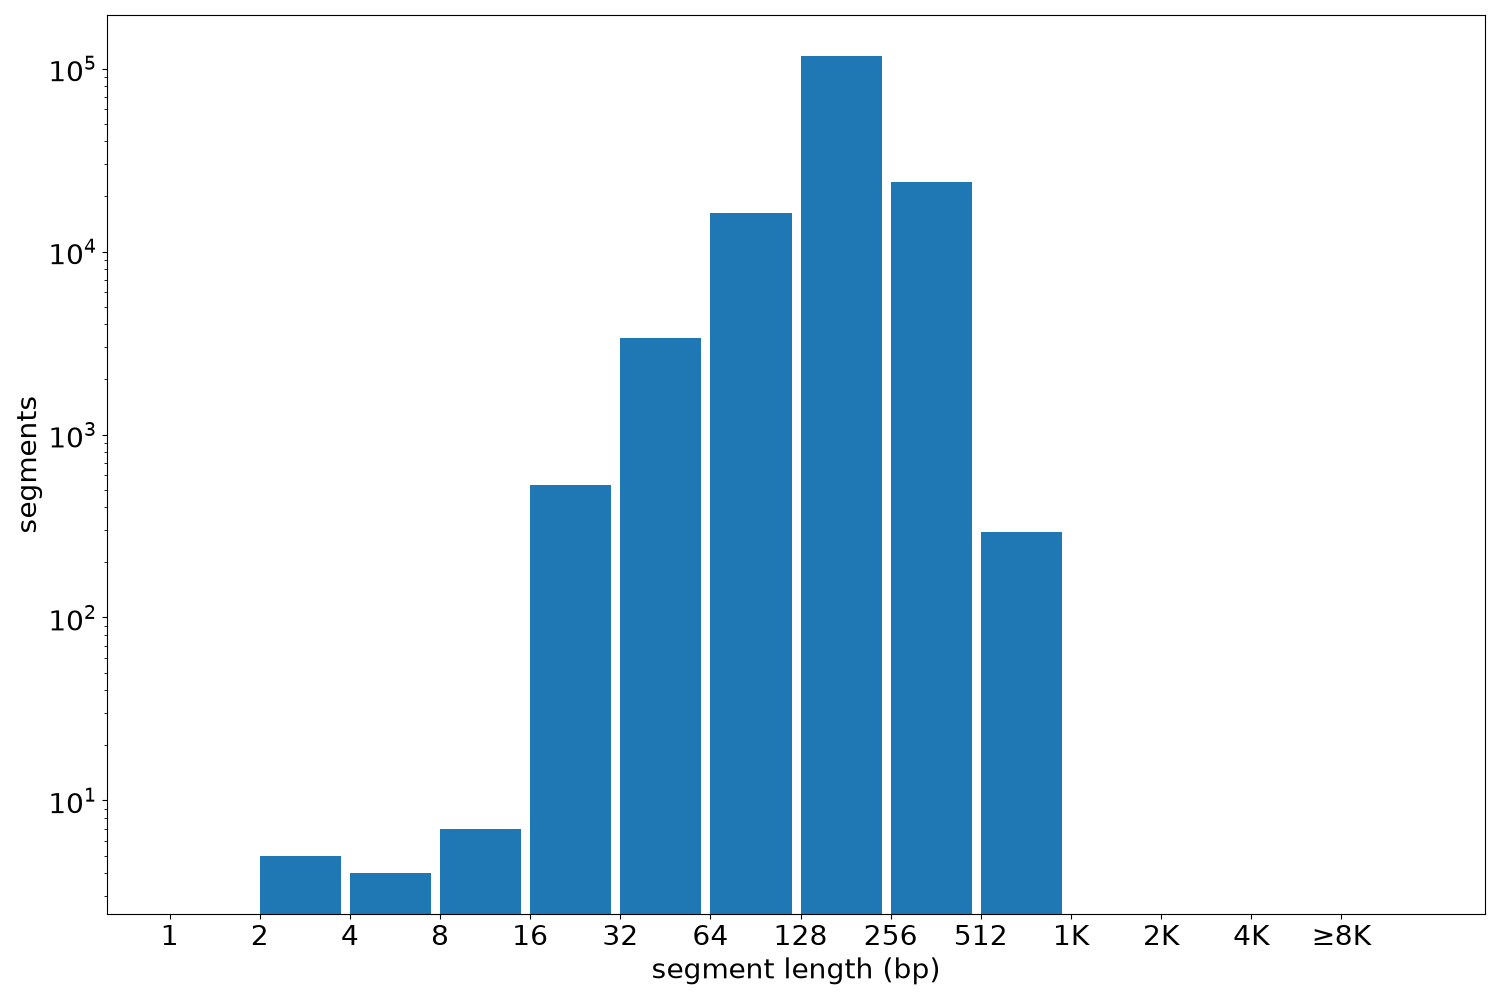
| segments | 161602 | 2 | 1000 | 197.23 | 200 |
Files
| Filename | Size | md5 |
|---|---|---|
| ENCFF459MDW.bed.gz | 1.76 MB | dc9d28f237bb3c65b3a39c6eed2463ec |
| ENCFF459MDW.tabix.bed.gz | 1.61 MB | 40658e50bc440bac7efb82f0b25ad64b |
| ENCFF459MDW.tabix.bed.gz.tbi | 475.49 KB | c6c91609bee5d91a8ed17d1f193d2b87 |
| genomic_resource.yaml | 2.0 KB | 8becb6c2d688d3d1192dd31b28120b97 |
| statistics/ |