Resource
| Id | DNase-seq/ENCSR290NGL |
|---|---|
| Type | position_score |
| Version | 0 |
| Summary | DNase-seq ENCSR290NGL [biosample_summary="Homo sapiens T-cell female adult (32 years)"] |
| Description |
status: released biological_replicates: Rep 1 summary: female adult (32 years) output_type: peaks audit_warning: Signal Portion of Tags (SPOT) is a measure of enrichment, analogous to the commonly used fraction of reads in peaks metric. ENCODE processed alignment files {ENCFF728ZLL|/files/ENCFF728ZLL/} processed by DNase-seq ENCODE4 v3.0.0-alpha.2 GRCh38 pipeline ({ENCPL848KLD|/pipelines/ENCPL848KLD/}) for GRCh38 assembly have a SPOT1 score of 0.35. According to ENCODE standards, SPOT1 score of 0.4 or higher is considered a product of high quality data. Any sample with a SPOT1 score <0.3 should be targeted for replacement with a higher quality sample, and a SPOT1 score of 0.25 is considered minimally acceptable SPOT1 score of 0.25 is considered minimally acceptable for rare and hard to find primary tissues. (See {ENCODE DNase-seq data standards|/data-standards/dnase-seq-encode4/}) |
| Labels |
|
Scores (1)
| ID | Type | Default annotation | Description | Histogram | Range | Summary |
|---|---|---|---|---|---|---|
| DNase-seq_ENCSR290NGL | float |
DNase-seq_ENCSR290NGL |
DNase-seq ENCSR290NGL [biosample_summary="Homo sapiens T-cell female adult (32 years)"]
|
 |
[0.105, 33] |
|
n counts base pairs; sd is the population standard deviation.
Coverage
| Chromosome | Covered positions | Covered % | Segments |
|---|---|---|---|
| all chromosomes | 6666282 | 0.21% | 34682 |
| chr1 | 677725 | 0.27% | 3520 |
| chr2 | 449797 | 0.19% | 2348 |
| chr3 | 358270 | 0.18% | 1859 |
| chr4 | 223134 | 0.12% | 1148 |
| chr5 | 291705 | 0.16% | 1515 |
| chr6 | 379971 | 0.22% | 1969 |
| chr7 | 306718 | 0.19% | 1588 |
| chr8 | 235722 | 0.16% | 1248 |
| chr9 | 257837 | 0.19% | 1347 |
| chr10 | 293372 | 0.22% | 1524 |
| chr11 | 338603 | 0.25% | 1767 |
| chr12 | 336362 | 0.25% | 1760 |
| chr13 | 130060 | 0.11% | 656 |
| chr14 | 241766 | 0.23% | 1243 |
| chr15 | 205860 | 0.20% | 1088 |
| chr16 | 287341 | 0.32% | 1503 |
| chr17 | 435623 | 0.52% | 2278 |
| chr18 | 96762 | 0.12% | 518 |
| chr19 | 507488 | 0.87% | 2542 |
| chr20 | 178589 | 0.28% | 969 |
| chr21 | 80100 | 0.17% | 419 |
| chr22 | 170114 | 0.33% | 920 |
| chrX | 183102 | 0.12% | 951 |
| chrY | 261 | <0.01% | 2 |
| 3342 contigs with no values (129077085 bp) | 0 | 0.00% | 0 |
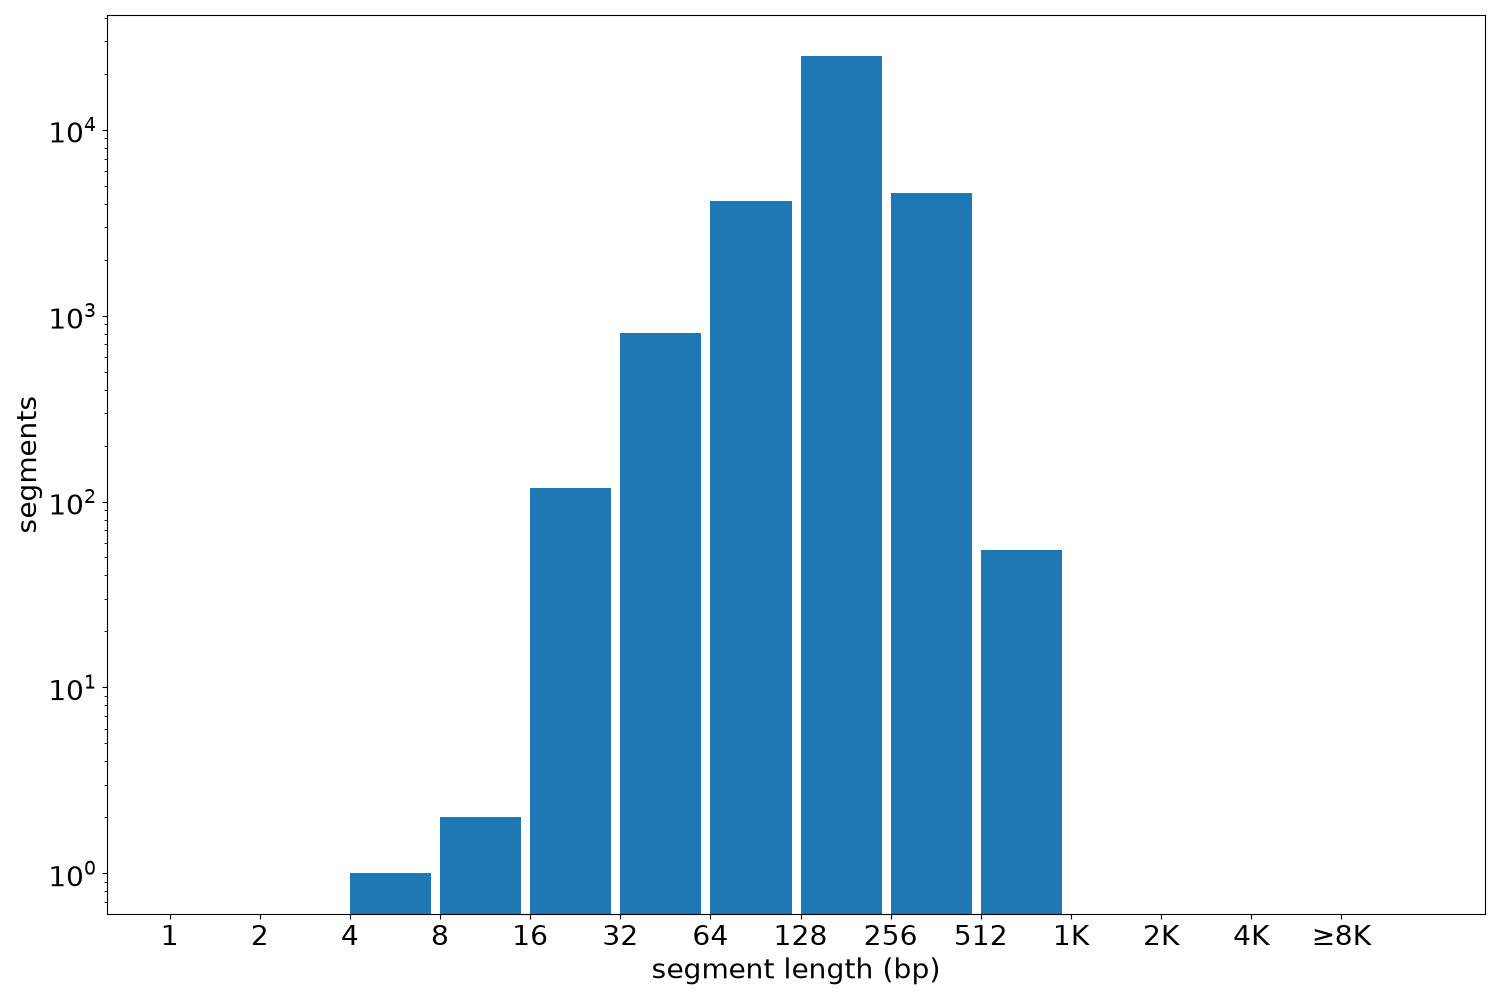
Segment lengths
| segments | min | max | mean | median | |
|---|---|---|---|---|---|
| segments | 34682 | 4 | 720 | 192.21 | 191 |
Files
| Filename | Size | md5 |
|---|---|---|
| ENCFF409NJS.bed.gz | 385.63 KB | a4860dcc17560af4f8a908781207d592 |
| ENCFF409NJS.tabix.bed.gz | 351.01 KB | ee45589b883d2618334dab989f10c17b |
| ENCFF409NJS.tabix.bed.gz.tbi | 182.64 KB | 01d8efb25d125e13f3d706a6abf660f2 |
| genomic_resource.yaml | 2.01 KB | cb7c031a4cefba0cbff3e6b461e72594 |
| statistics/ |