Resource
| Id | DNase-seq/ENCSR278FVO |
|---|---|
| Type | position_score |
| Version | 0 |
| Summary | DNase-seq ENCSR278FVO [biosample_summary="Homo sapiens neuronal stem cell originated from H1"] |
| Description |
status: released biological_replicates: Rep 1 summary: male embryo output_type: peaks audit_warning: Signal Portion of Tags (SPOT) is a measure of enrichment, analogous to the commonly used fraction of reads in peaks metric. ENCODE processed alignment files {ENCFF224MAE|/files/ENCFF224MAE/} processed by DNase-seq ENCODE4 v3.0.0-alpha.2 GRCh38 pipeline ({ENCPL848KLD|/pipelines/ENCPL848KLD/}) for GRCh38 assembly have a SPOT1 score of 0.26. According to ENCODE standards, SPOT1 score of 0.4 or higher is considered a product of high quality data. Any sample with a SPOT1 score <0.3 should be targeted for replacement with a higher quality sample, and a SPOT1 score of 0.25 is considered minimally acceptable SPOT1 score of 0.25 is considered minimally acceptable for rare and hard to find primary tissues. (See {ENCODE DNase-seq data standards|/data-standards/dnase-seq-encode4/}) |
| Labels |
|
Scores (1)
| ID | Type | Default annotation | Description | Histogram | Range | Summary |
|---|---|---|---|---|---|---|
| DNase-seq_ENCSR278FVO | float |
DNase-seq_ENCSR278FVO |
DNase-seq ENCSR278FVO [biosample_summary="Homo sapiens neuronal stem cell originated from H1"]
|
 |
[0.125, 23.9] |
|
n counts base pairs; sd is the population standard deviation.
Coverage
| Chromosome | Covered positions | Covered % | Segments |
|---|---|---|---|
| all chromosomes | 15219054 | 0.47% | 72733 |
| chr1 | 1399710 | 0.56% | 6613 |
| chr2 | 1171943 | 0.48% | 5688 |
| chr3 | 925293 | 0.47% | 4415 |
| chr4 | 778154 | 0.41% | 3687 |
| chr5 | 827852 | 0.46% | 3967 |
| chr6 | 948196 | 0.56% | 4474 |
| chr7 | 759996 | 0.48% | 3696 |
| chr8 | 686999 | 0.47% | 3373 |
| chr9 | 630786 | 0.46% | 3061 |
| chr10 | 694453 | 0.52% | 3395 |
| chr11 | 774044 | 0.57% | 3723 |
| chr12 | 782381 | 0.59% | 3678 |
| chr13 | 393258 | 0.34% | 1905 |
| chr14 | 494307 | 0.46% | 2321 |
| chr15 | 510343 | 0.50% | 2434 |
| chr16 | 520747 | 0.58% | 2496 |
| chr17 | 677781 | 0.81% | 3162 |
| chr18 | 342259 | 0.43% | 1652 |
| chr19 | 659853 | 1.13% | 2976 |
| chr20 | 390842 | 0.61% | 1865 |
| chr21 | 147662 | 0.32% | 713 |
| chr22 | 270925 | 0.53% | 1303 |
| chrX | 416926 | 0.27% | 2061 |
| chrY | 14344 | 0.03% | 75 |
| 3342 contigs with no values (129077085 bp) | 0 | 0.00% | 0 |
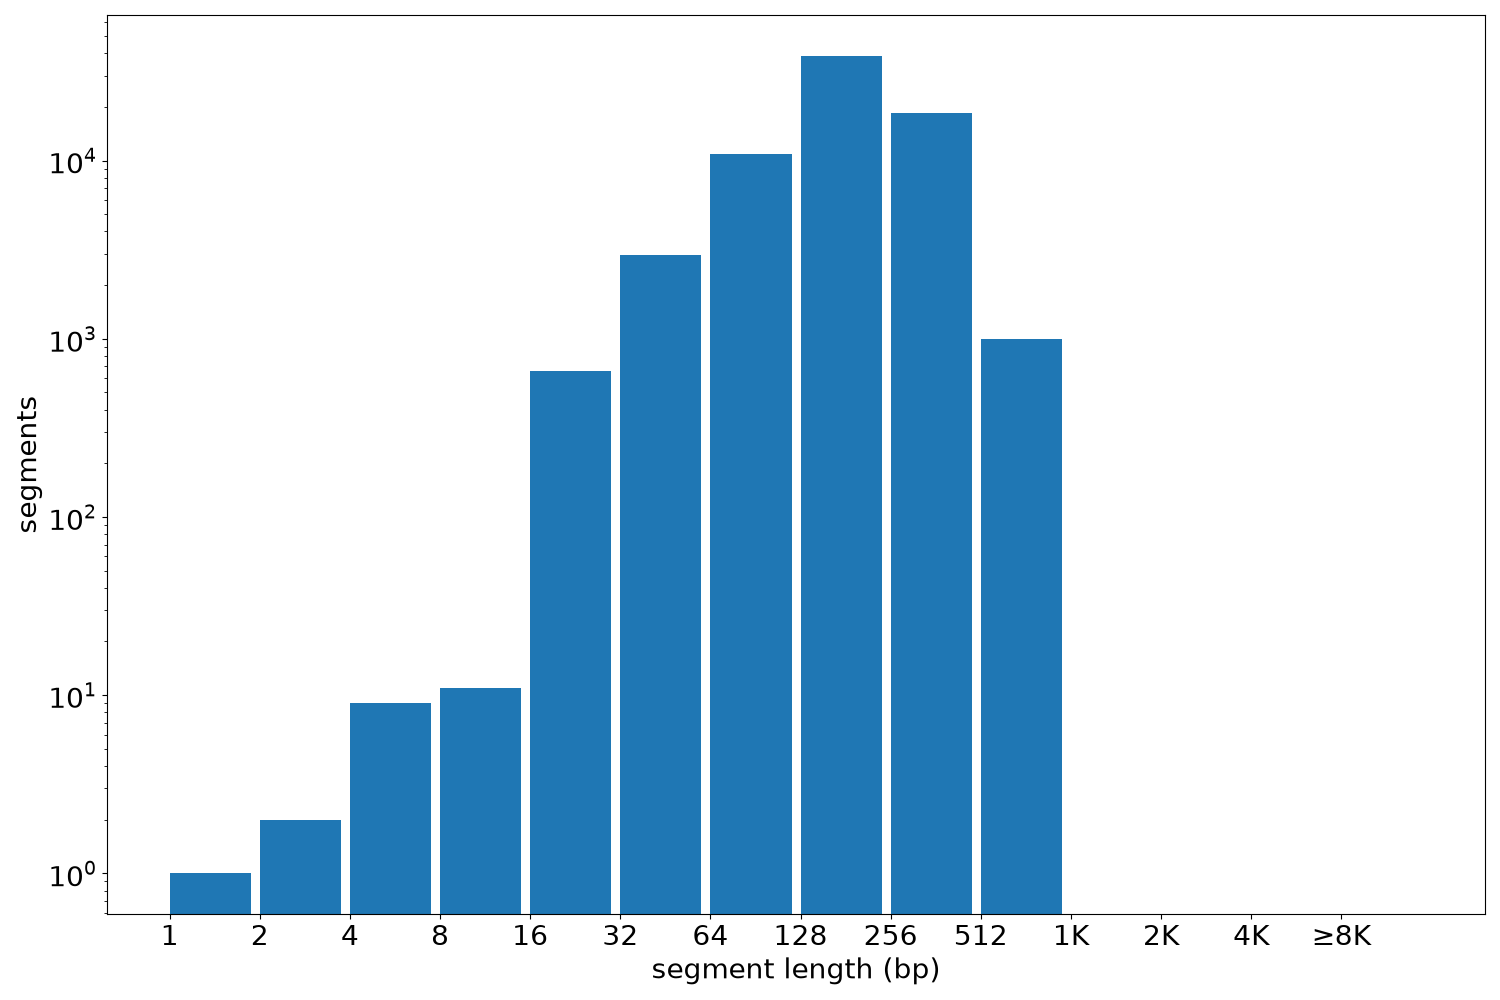
Segment lengths
| segments | min | max | mean | median | |
|---|---|---|---|---|---|
| segments | 72733 | 1 | 980 | 209.25 | 200 |
Files
| Filename | Size | md5 |
|---|---|---|
| ENCFF732IUC.bed.gz | 756.84 KB | dda8c873833deaed89187ce953ee54c0 |
| ENCFF732IUC.tabix.bed.gz | 696.23 KB | 4d30f65a8403b3c97e0061ea43662aa8 |
| ENCFF732IUC.tabix.bed.gz.tbi | 353.42 KB | 42a8a33c68c7a71b153f97db1834e7b9 |
| genomic_resource.yaml | 2.02 KB | a0a5538a350ed51cf540621e9b8ef95c |
| statistics/ |