Resource
| Id | DNase-seq/ENCSR260UJJ |
|---|---|
| Type | position_score |
| Version | 0 |
| Summary | DNase-seq ENCSR260UJJ [biosample_summary="Homo sapiens T-helper 1 cell male adult (42 years)"] |
| Description |
status: released biological_replicates: Rep 1 summary: male adult (42 years) output_type: peaks audit_warning: Signal Portion of Tags (SPOT) is a measure of enrichment, analogous to the commonly used fraction of reads in peaks metric. ENCODE processed alignment files {ENCFF060ORA|/files/ENCFF060ORA/} processed by DNase-seq ENCODE4 v3.0.0-alpha.2 GRCh38 pipeline ({ENCPL848KLD|/pipelines/ENCPL848KLD/}) for GRCh38 assembly have a SPOT1 score of 0.36. According to ENCODE standards, SPOT1 score of 0.4 or higher is considered a product of high quality data. Any sample with a SPOT1 score <0.3 should be targeted for replacement with a higher quality sample, and a SPOT1 score of 0.25 is considered minimally acceptable SPOT1 score of 0.25 is considered minimally acceptable for rare and hard to find primary tissues. (See {ENCODE DNase-seq data standards|/data-standards/dnase-seq-encode4/}) |
| Labels |
|
Scores (1)
| ID | Type | Default annotation | Description | Histogram | Range | Summary |
|---|---|---|---|---|---|---|
| DNase-seq_ENCSR260UJJ | float |
DNase-seq_ENCSR260UJJ |
DNase-seq ENCSR260UJJ [biosample_summary="Homo sapiens T-helper 1 cell male adult (42 years)"]
|
 |
[0.185, 28] |
|
n counts base pairs; sd is the population standard deviation.
Coverage
| Chromosome | Covered positions | Covered % | Segments |
|---|---|---|---|
| all chromosomes | 4963331 | 0.15% | 25920 |
| chr1 | 511702 | 0.21% | 2688 |
| chr2 | 333683 | 0.14% | 1748 |
| chr3 | 254377 | 0.13% | 1323 |
| chr4 | 159118 | 0.08% | 823 |
| chr5 | 224376 | 0.12% | 1169 |
| chr6 | 258974 | 0.15% | 1362 |
| chr7 | 218978 | 0.14% | 1132 |
| chr8 | 168306 | 0.12% | 917 |
| chr9 | 200197 | 0.14% | 1032 |
| chr10 | 211387 | 0.16% | 1102 |
| chr11 | 268276 | 0.20% | 1393 |
| chr12 | 251733 | 0.19% | 1298 |
| chr13 | 95291 | 0.08% | 490 |
| chr14 | 174324 | 0.16% | 915 |
| chr15 | 163658 | 0.16% | 854 |
| chr16 | 215526 | 0.24% | 1121 |
| chr17 | 325514 | 0.39% | 1715 |
| chr18 | 64465 | 0.08% | 339 |
| chr19 | 399650 | 0.68% | 2032 |
| chr20 | 136144 | 0.21% | 735 |
| chr21 | 53581 | 0.11% | 291 |
| chr22 | 127238 | 0.25% | 675 |
| chrX | 140907 | 0.09% | 738 |
| chrY | 5926 | 0.01% | 28 |
| 3342 contigs with no values (129077085 bp) | 0 | 0.00% | 0 |
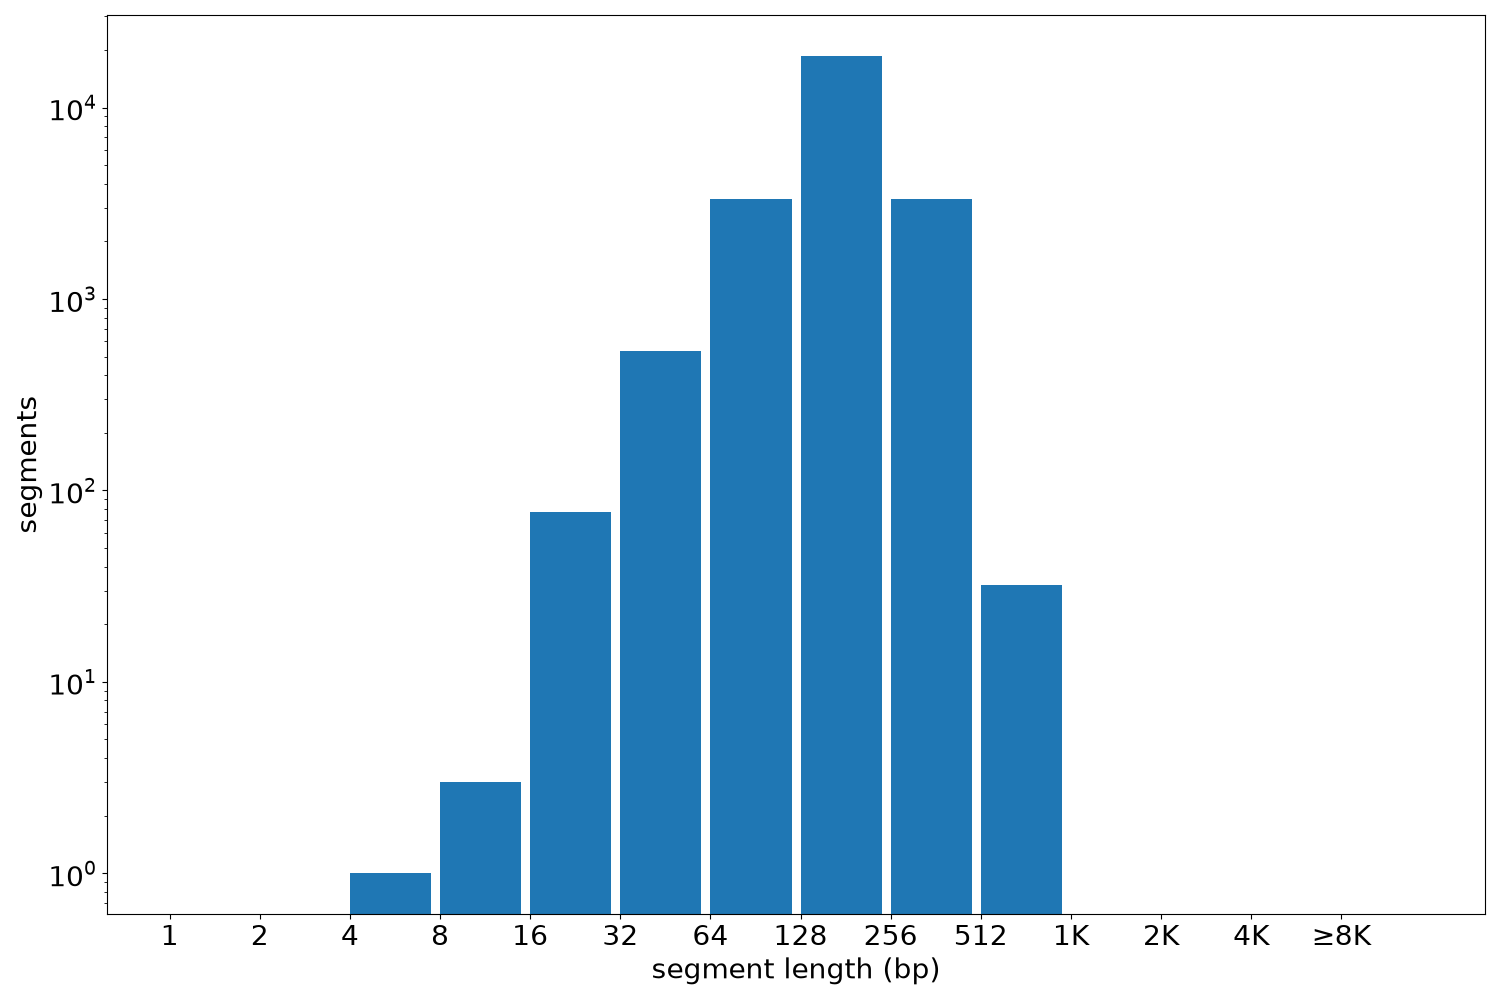
Segment lengths
| segments | min | max | mean | median | |
|---|---|---|---|---|---|
| segments | 25920 | 5 | 680 | 191.49 | 198 |
Files
| Filename | Size | md5 |
|---|---|---|
| ENCFF503PRJ.bed.gz | 289.43 KB | 696236ca48e314257efea089da1e2321 |
| ENCFF503PRJ.tabix.bed.gz | 262.2 KB | 42cd73ec9a7a6936a1595101335de3c3 |
| ENCFF503PRJ.tabix.bed.gz.tbi | 151.56 KB | 8f0d86964193aef1f30a5cd24cd9bfb1 |
| genomic_resource.yaml | 2.02 KB | ffbf5eb4ddec5af7104574f5c452f9c2 |
| statistics/ |