Resource
| Id | DNase-seq/ENCSR171ETY |
|---|---|
| Type | position_score |
| Version | 0 |
| Summary | DNase-seq ENCSR171ETY [biosample_summary="Homo sapiens gastrocnemius medialis tissue male adult (54 years)"] |
| Description |
status: released biological_replicates: Rep 1 summary: male adult (54 years) output_type: peaks audit_warning: Signal Portion of Tags (SPOT) is a measure of enrichment, analogous to the commonly used fraction of reads in peaks metric. ENCODE processed alignment files {ENCFF109XKX|/files/ENCFF109XKX/} processed by DNase-seq ENCODE4 v3.0.0-alpha.2 GRCh38 pipeline ({ENCPL848KLD|/pipelines/ENCPL848KLD/}) for GRCh38 assembly have a SPOT1 score of 0.30. According to ENCODE standards, SPOT1 score of 0.4 or higher is considered a product of high quality data. Any sample with a SPOT1 score <0.3 should be targeted for replacement with a higher quality sample, and a SPOT1 score of 0.25 is considered minimally acceptable SPOT1 score of 0.25 is considered minimally acceptable for rare and hard to find primary tissues. (See {ENCODE DNase-seq data standards|/data-standards/dnase-seq-encode4/}) |
| Labels |
|
Scores (1)
| ID | Type | Default annotation | Description | Histogram | Range | Summary |
|---|---|---|---|---|---|---|
| DNase-seq_ENCSR171ETY | float |
DNase-seq_ENCSR171ETY |
DNase-seq ENCSR171ETY [biosample_summary="Homo sapiens gastrocnemius medialis tissue male adult (54 years)"]
|
 |
[0.0283, 13.3] |
|
n counts base pairs; sd is the population standard deviation.
Coverage
| Chromosome | Covered positions | Covered % | Segments |
|---|---|---|---|
| all chromosomes | 29293393 | 0.91% | 129937 |
| chr1 | 2829362 | 1.14% | 11987 |
| chr2 | 3031173 | 1.25% | 13518 |
| chr3 | 1743675 | 0.88% | 7647 |
| chr4 | 729753 | 0.38% | 3251 |
| chr5 | 1420359 | 0.78% | 6248 |
| chr6 | 1492795 | 0.87% | 6490 |
| chr7 | 1362348 | 0.85% | 6126 |
| chr8 | 1374831 | 0.95% | 6256 |
| chr9 | 1378040 | 1.00% | 6090 |
| chr10 | 1983119 | 1.48% | 9094 |
| chr11 | 1505747 | 1.11% | 6714 |
| chr12 | 1093845 | 0.82% | 4761 |
| chr13 | 689252 | 0.60% | 3047 |
| chr14 | 880562 | 0.82% | 3892 |
| chr15 | 1162677 | 1.14% | 5337 |
| chr16 | 1050867 | 1.16% | 4787 |
| chr17 | 1373587 | 1.65% | 5868 |
| chr18 | 687567 | 0.86% | 3243 |
| chr19 | 972163 | 1.66% | 4114 |
| chr20 | 943942 | 1.46% | 4302 |
| chr21 | 403665 | 0.86% | 1904 |
| chr22 | 842491 | 1.66% | 3844 |
| chrX | 330350 | 0.21% | 1372 |
| chrY | 11223 | 0.02% | 45 |
| 3342 contigs with no values (129077085 bp) | 0 | 0.00% | 0 |
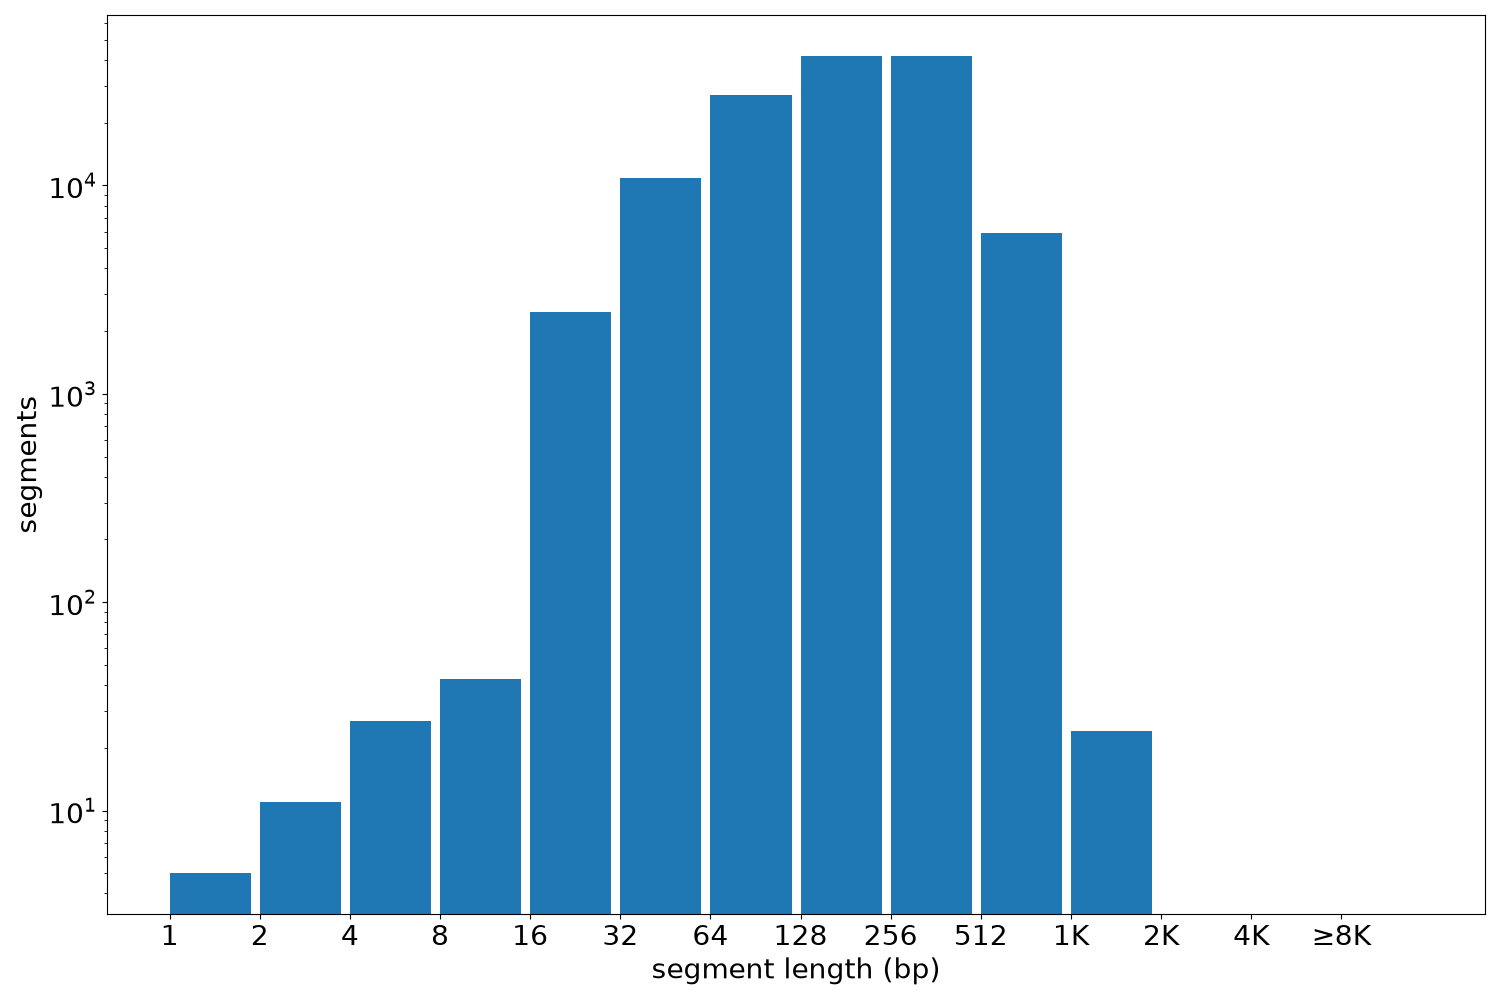
Segment lengths
| segments | min | max | mean | median | |
|---|---|---|---|---|---|
| segments | 129937 | 1 | 1260 | 225.44 | 200 |
Files
| Filename | Size | md5 |
|---|---|---|
| ENCFF978FIB.bed.gz | 1.24 MB | 49400331d4ea66aad67ad21cc0c73b2f |
| ENCFF978FIB.tabix.bed.gz | 1.18 MB | d5ed5c4cb109ad4f0ad1c5e1764e9e6a |
| ENCFF978FIB.tabix.bed.gz.tbi | 236.89 KB | 48b144c44720a1beb6d8f59fbacac312 |
| genomic_resource.yaml | 2.06 KB | 31eb3e1a473ab4947063b468462c444a |
| statistics/ |