Resource
| Id | DNase-seq/ENCSR169KNO |
|---|---|
| Type | position_score |
| Version | 0 |
| Summary | DNase-seq ENCSR169KNO [biosample_summary="Homo sapiens progenitor cell of endocrine pancreas"] |
| Description |
status: released biological_replicates: Rep 1 summary: female embryo (5 days) output_type: peaks audit_warning: Signal Portion of Tags (SPOT) is a measure of enrichment, analogous to the commonly used fraction of reads in peaks metric. ENCODE processed alignment files {ENCFF008WMZ|/files/ENCFF008WMZ/} processed by DNase-seq ENCODE4 v3.0.0 GRCh38 pipeline ({ENCPL848KLD|/pipelines/ENCPL848KLD/}) for GRCh38 assembly have a SPOT1 score of 0.30. According to ENCODE standards, SPOT1 score of 0.4 or higher is considered a product of high quality data. Any sample with a SPOT1 score <0.3 should be targeted for replacement with a higher quality sample, and a SPOT1 score of 0.25 is considered minimally acceptable SPOT1 score of 0.25 is considered minimally acceptable for rare and hard to find primary tissues. (See {ENCODE DNase-seq data standards|/data-standards/dnase-seq-encode4/}) |
| Labels |
|
Scores (1)
| ID | Type | Default annotation | Description | Histogram | Range | Summary |
|---|---|---|---|---|---|---|
| DNase-seq_ENCSR169KNO | float |
DNase-seq_ENCSR169KNO |
DNase-seq ENCSR169KNO [biosample_summary="Homo sapiens progenitor cell of endocrine pancreas"]
|
 |
[0.0606, 16.3] |
|
n counts base pairs; sd is the population standard deviation.
Coverage
| Chromosome | Covered positions | Covered % | Segments |
|---|---|---|---|
| all chromosomes | 10758703 | 0.33% | 51043 |
| chr1 | 1056478 | 0.42% | 4960 |
| chr2 | 772461 | 0.32% | 3741 |
| chr3 | 588700 | 0.30% | 2759 |
| chr4 | 433229 | 0.23% | 1996 |
| chr5 | 514868 | 0.28% | 2453 |
| chr6 | 565478 | 0.33% | 2626 |
| chr7 | 504704 | 0.32% | 2388 |
| chr8 | 459330 | 0.32% | 2183 |
| chr9 | 458935 | 0.33% | 2172 |
| chr10 | 534100 | 0.40% | 2598 |
| chr11 | 591042 | 0.44% | 2851 |
| chr12 | 572401 | 0.43% | 2656 |
| chr13 | 220360 | 0.19% | 1017 |
| chr14 | 357446 | 0.33% | 1668 |
| chr15 | 372190 | 0.36% | 1782 |
| chr16 | 397250 | 0.44% | 1920 |
| chr17 | 572687 | 0.69% | 2721 |
| chr18 | 193256 | 0.24% | 895 |
| chr19 | 603409 | 1.03% | 2794 |
| chr20 | 310180 | 0.48% | 1526 |
| chr21 | 135972 | 0.29% | 667 |
| chr22 | 250576 | 0.49% | 1266 |
| chrX | 293330 | 0.19% | 1401 |
| chrY | 321 | <0.01% | 3 |
| 3342 contigs with no values (129077085 bp) | 0 | 0.00% | 0 |
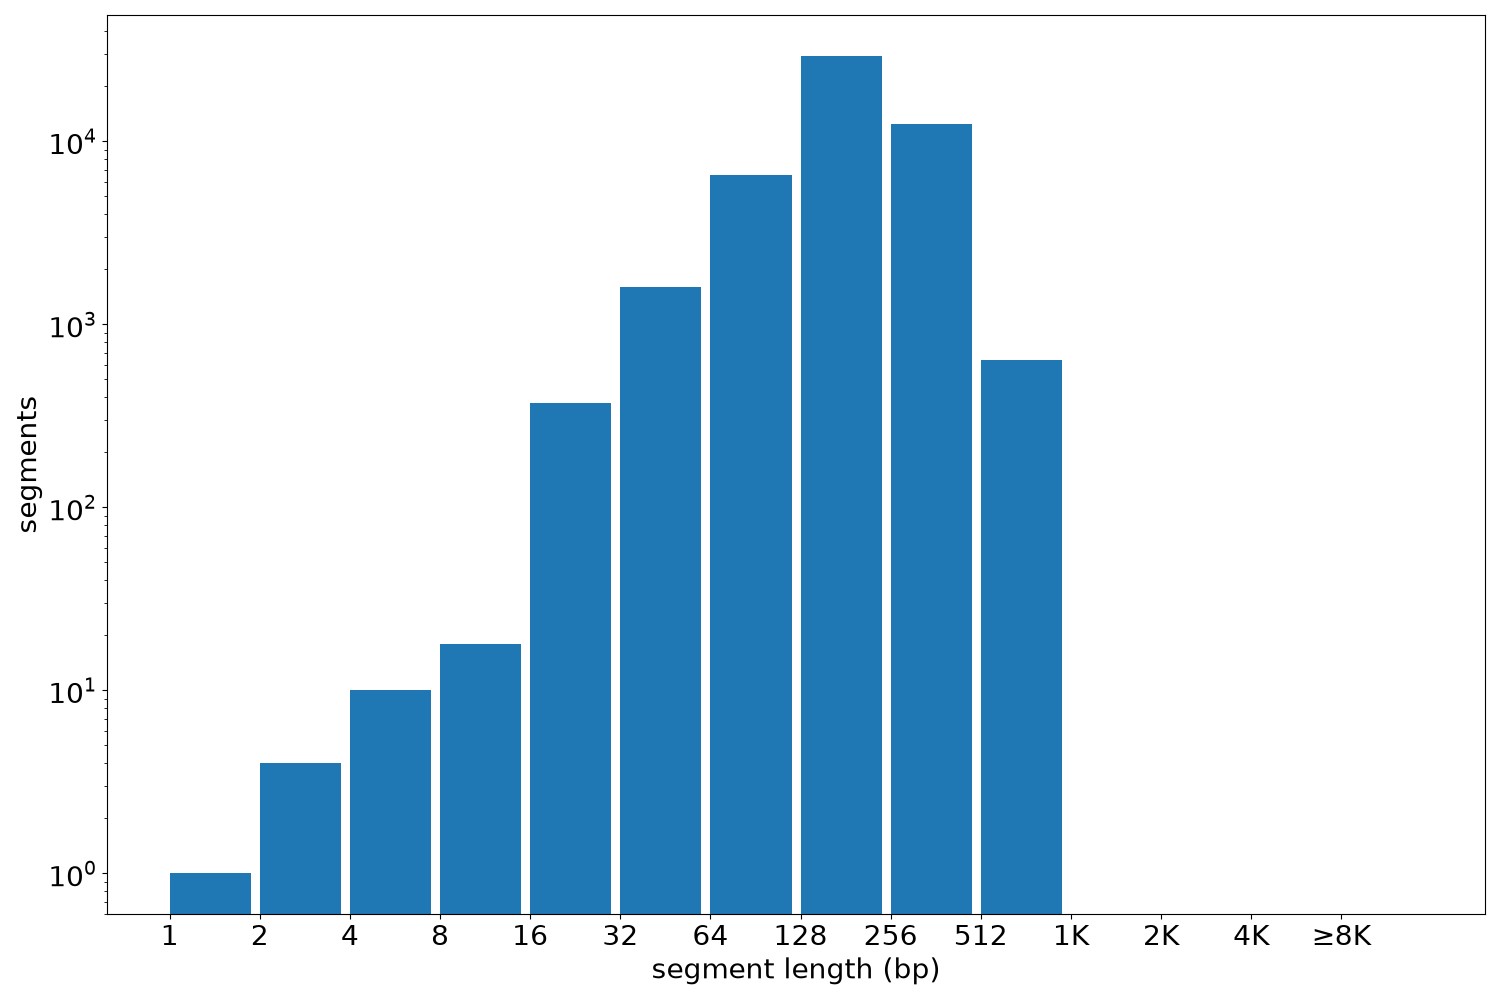
Segment lengths
| segments | min | max | mean | median | |
|---|---|---|---|---|---|
| segments | 51043 | 1 | 1020 | 210.78 | 200 |
Files
| Filename | Size | md5 |
|---|---|---|
| ENCFF971MIV.bed.gz | 554.96 KB | 8c665bebd407dd17d443e717d364fd03 |
| ENCFF971MIV.tabix.bed.gz | 512.38 KB | 513628f4a58631fa332f434e10468bb3 |
| ENCFF971MIV.tabix.bed.gz.tbi | 237.9 KB | d165fcde73bf94cfea484ef1b78ea7e6 |
| genomic_resource.yaml | 2.03 KB | 172f1d302ade3e86786ebbfcb1aadd6c |
| statistics/ |