Resource
| Id | DNase-seq/ENCSR164PQJ |
|---|---|
| Type | position_score |
| Version | 0 |
| Summary | DNase-seq ENCSR164PQJ [biosample_summary="Homo sapiens thymus tissue male embryo (127 days)"] |
| Description |
status: released biological_replicates: Rep 1 summary: male embryo (127 days) output_type: peaks audit_internal_action: Archived analysis {ENCAN089DEA|/analyses/ENCAN089DEA/} has in progress subobject quality standard {encode3-dnase|/quality-standards/encode3-dnase/} audit_warning: Signal Portion of Tags (SPOT) is a measure of enrichment, analogous to the commonly used fraction of reads in peaks metric. ENCODE processed alignment files {ENCFF911BTJ|/files/ENCFF911BTJ/} processed by DNase-seq ENCODE3 GRCh38 pipeline ({ENCPL001DNS|/pipelines/ENCPL001DNS/}) for GRCh38 assembly have a SPOT1 score of 0.37. According to ENCODE standards, SPOT1 score of 0.4 or higher is considered a product of high quality data. Any sample with a SPOT1 score <0.3 should be targeted for replacement with a higher quality sample, and a SPOT1 score of 0.25 is considered minimally acceptable SPOT1 score of 0.25 is considered minimally acceptable for rare and hard to find primary tissues. (See {ENCODE DNase-seq data standards|/data-standards/dnase-seq/}) |
| Labels |
|
Scores (1)
| ID | Type | Default annotation | Description | Histogram | Range | Summary |
|---|---|---|---|---|---|---|
| DNase-seq_ENCSR164PQJ | float |
DNase-seq_ENCSR164PQJ |
DNase-seq ENCSR164PQJ [biosample_summary="Homo sapiens thymus tissue male embryo (127 days)"]
|
 |
[5, 3.38e+03] |
|
n counts base pairs; sd is the population standard deviation.
Coverage
| Chromosome | Covered positions | Covered % | Segments |
|---|---|---|---|
| all chromosomes | 14098270 | 0.44% | 93786 |
| chr1 | 1330924 | 0.53% | 8862 |
| chr2 | 1103552 | 0.46% | 7340 |
| chr3 | 917757 | 0.46% | 6104 |
| chr4 | 643192 | 0.34% | 4283 |
| chr5 | 700280 | 0.39% | 4657 |
| chr6 | 836604 | 0.49% | 5570 |
| chr7 | 702783 | 0.44% | 4678 |
| chr8 | 588336 | 0.41% | 3909 |
| chr9 | 576547 | 0.42% | 3835 |
| chr10 | 661066 | 0.49% | 4403 |
| chr11 | 672711 | 0.50% | 4469 |
| chr12 | 703219 | 0.53% | 4679 |
| chr13 | 369286 | 0.32% | 2445 |
| chr14 | 471405 | 0.44% | 3134 |
| chr15 | 455939 | 0.45% | 3035 |
| chr16 | 498450 | 0.55% | 3316 |
| chr17 | 667078 | 0.80% | 4439 |
| chr18 | 287320 | 0.36% | 1908 |
| chr19 | 579144 | 0.99% | 3856 |
| chr20 | 388055 | 0.60% | 2581 |
| chr21 | 173968 | 0.37% | 1158 |
| chr22 | 293600 | 0.58% | 1957 |
| chrX | 453354 | 0.29% | 3011 |
| chrY | 23700 | 0.04% | 157 |
| 3342 contigs with no values (129077085 bp) | 0 | 0.00% | 0 |
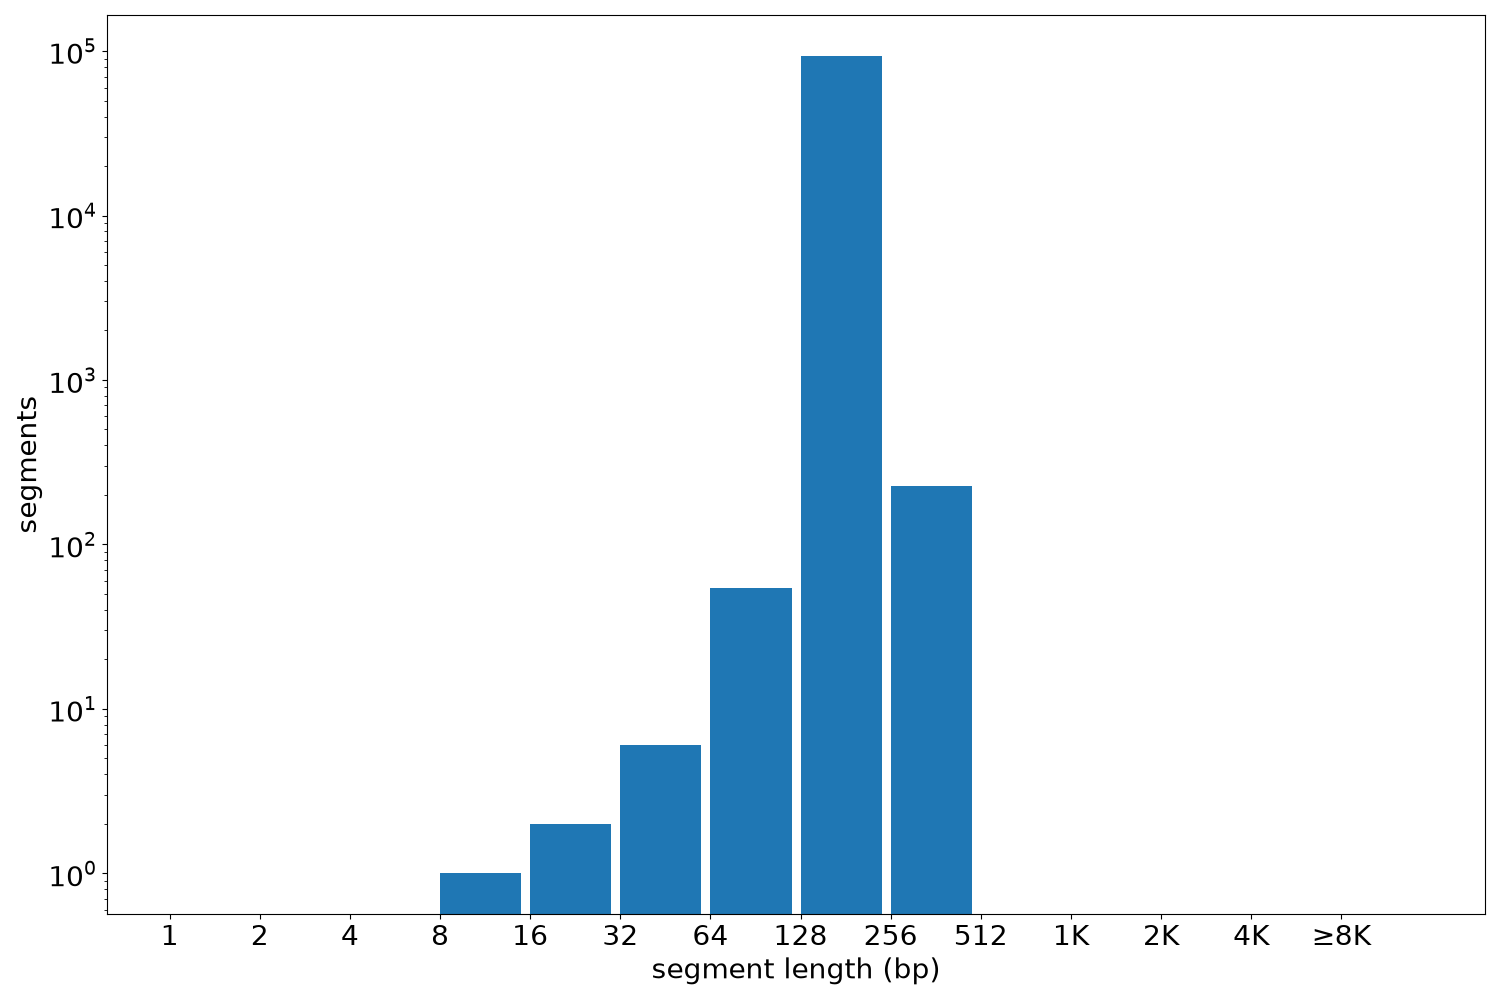
Segment lengths
| segments | min | max | mean | median | |
|---|---|---|---|---|---|
| segments | 93786 | 9 | 450 | 150.32 | 150 |
Files
| Filename | Size | md5 |
|---|---|---|
| ENCFF221AJA.bed.gz | 923.81 KB | 2146404ab77f239ecffd216d15d7cab0 |
| ENCFF221AJA.tabix.bed.gz | 793.66 KB | d49d8837294bb594e5edb3b7815621c8 |
| ENCFF221AJA.tabix.bed.gz.tbi | 406.22 KB | ddd8eaaf6d7a5393464a31af71611af7 |
| genomic_resource.yaml | 2.18 KB | 6b7cae1bb79feded8f014ee129b5bcc2 |
| statistics/ |