Resource
| Id | DNase-seq/ENCSR139KYP |
|---|---|
| Type | position_score |
| Version | 0 |
| Summary | DNase-seq ENCSR139KYP [biosample_summary="Homo sapiens T-helper 17 cell female adult (25 years)"] |
| Description |
status: released biological_replicates: Rep 2 summary: female adult (25 years) output_type: peaks audit_warning: Signal Portion of Tags (SPOT) is a measure of enrichment, analogous to the commonly used fraction of reads in peaks metric. ENCODE processed alignment files {ENCFF301RBU|/files/ENCFF301RBU/} processed by DNase-seq ENCODE4 v3.0.0-alpha.2 GRCh38 pipeline ({ENCPL848KLD|/pipelines/ENCPL848KLD/}) for GRCh38 assembly have a SPOT1 score of 0.38. According to ENCODE standards, SPOT1 score of 0.4 or higher is considered a product of high quality data. Any sample with a SPOT1 score <0.3 should be targeted for replacement with a higher quality sample, and a SPOT1 score of 0.25 is considered minimally acceptable SPOT1 score of 0.25 is considered minimally acceptable for rare and hard to find primary tissues. (See {ENCODE DNase-seq data standards|/data-standards/dnase-seq-encode4/}) |
| Labels |
|
Scores (1)
| ID | Type | Default annotation | Description | Histogram | Range | Summary |
|---|---|---|---|---|---|---|
| DNase-seq_ENCSR139KYP | float |
DNase-seq_ENCSR139KYP |
DNase-seq ENCSR139KYP [biosample_summary="Homo sapiens T-helper 17 cell female adult (25 years)"]
|
 |
[0.213, 21.8] |
|
n counts base pairs; sd is the population standard deviation.
Coverage
| Chromosome | Covered positions | Covered % | Segments |
|---|---|---|---|
| all chromosomes | 5015452 | 0.16% | 23180 |
| chr1 | 520399 | 0.21% | 2416 |
| chr2 | 339975 | 0.14% | 1555 |
| chr3 | 270576 | 0.14% | 1227 |
| chr4 | 178971 | 0.09% | 805 |
| chr5 | 216686 | 0.12% | 987 |
| chr6 | 273208 | 0.16% | 1264 |
| chr7 | 229189 | 0.14% | 1077 |
| chr8 | 172174 | 0.12% | 798 |
| chr9 | 194643 | 0.14% | 900 |
| chr10 | 206019 | 0.15% | 937 |
| chr11 | 263840 | 0.20% | 1236 |
| chr12 | 259369 | 0.19% | 1188 |
| chr13 | 103233 | 0.09% | 447 |
| chr14 | 173823 | 0.16% | 809 |
| chr15 | 154709 | 0.15% | 732 |
| chr16 | 222466 | 0.25% | 1040 |
| chr17 | 321581 | 0.39% | 1497 |
| chr18 | 68543 | 0.09% | 307 |
| chr19 | 391047 | 0.67% | 1792 |
| chr20 | 133680 | 0.21% | 640 |
| chr21 | 56671 | 0.12% | 285 |
| chr22 | 127062 | 0.25% | 610 |
| chrX | 137588 | 0.09% | 631 |
| 3343 contigs with no values (186304500 bp) | 0 | 0.00% | 0 |
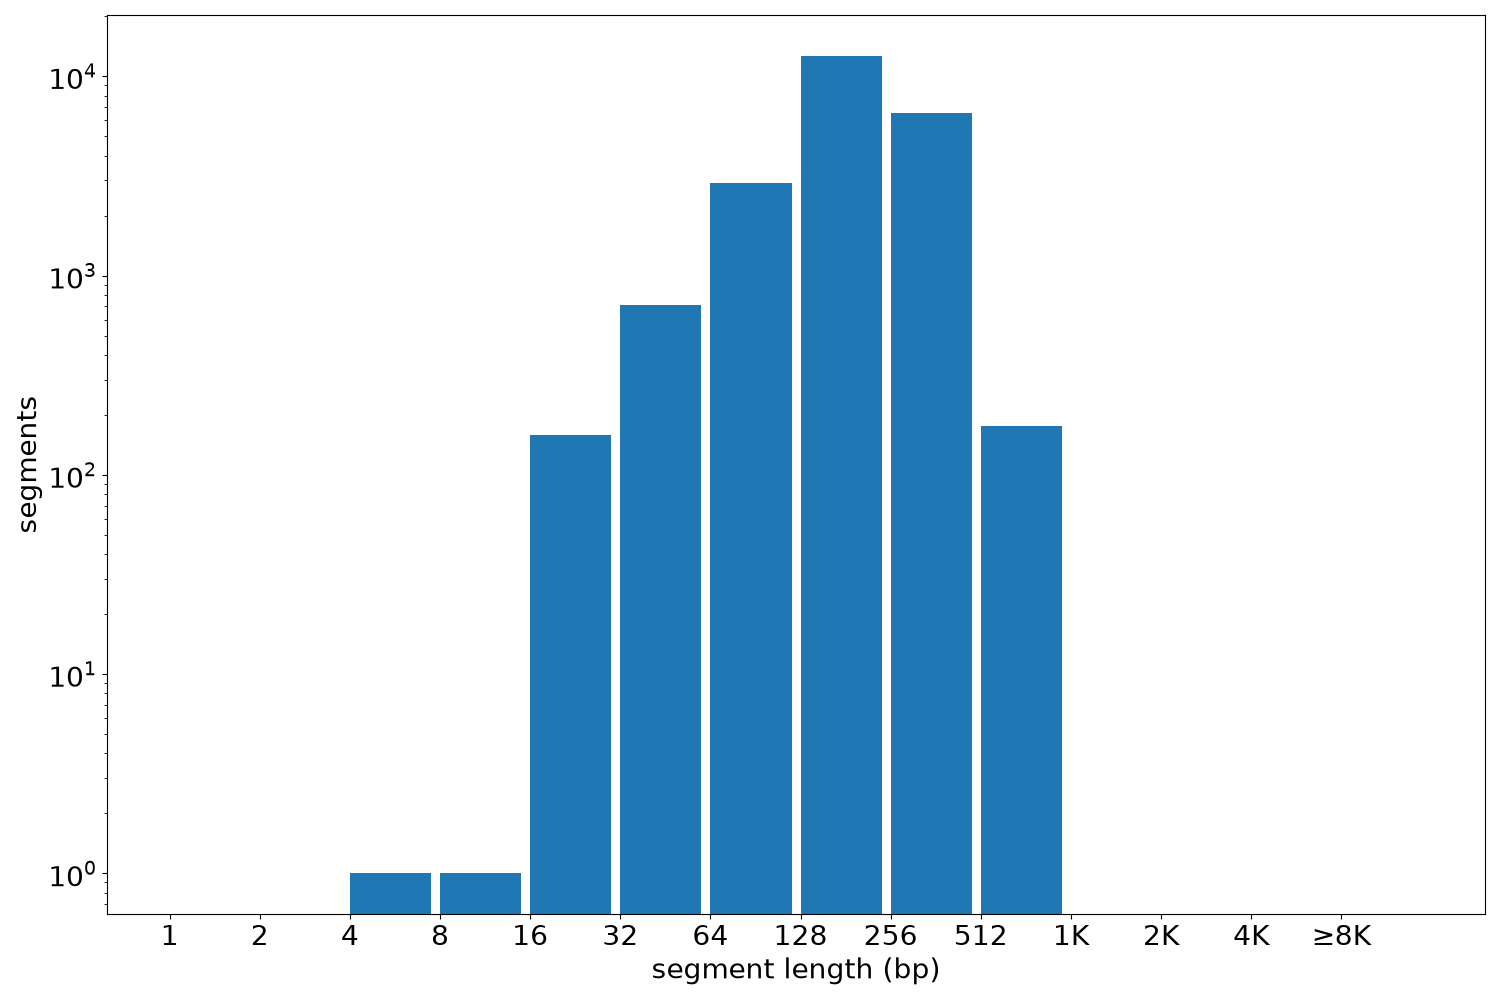
Segment lengths
| segments | min | max | mean | median | |
|---|---|---|---|---|---|
| segments | 23180 | 4 | 840 | 216.37 | 220 |
Files
| Filename | Size | md5 |
|---|---|---|
| ENCFF815HBL.bed.gz | 255.35 KB | 76643542281a9dc962e89ec9b5e35d1f |
| ENCFF815HBL.tabix.bed.gz | 233.81 KB | baee40927e787b23bde3ed0ab8b36ec7 |
| ENCFF815HBL.tabix.bed.gz.tbi | 128.97 KB | 76d474f79a7a242c075116c98c44d7cd |
| genomic_resource.yaml | 2.14 KB | f13b2c9425c5cc47a8b15f2f40bd2144 |
| statistics/ |